Keywords
Growth curve; Growth models; Early child development; First years of life
Introduction
Assessing the anthropometric and cognitive development of children is among the most important primary aims of pediatric clinical trials and cohort studies. Having standardized growth curves for the population in which such studies are conducted is essential to form a comparison platform for the study population against the general population. To address such requirements and to monitor developmental changes of the whole populations over time, Center for Disease Control (CDC) of the United States undertook an effort to generate standard growth curves for the US population in 1970s [1-7]. Such efforts also took place in describing growth curve for international populations as well [8-12]. Ozturk et al. proposed growth charts for Turkish children aged 0-18 years [13].
In pediatric clinical trials and cohort studies, actual height and weight of children at a specific age, say 24-months, is required for certain developmental assessments such as energy expenditure. More often than not, study participants may not have anthropometric measurements exactly at that time point of interest, or may have them at a close neighbourhood of that time point of interest, say ±3 months, etc., and the predictions of anthropometric measurements must be made to obtain measurements at those exact time points. This necessitates that a growth curve models with desirable prediction characteristics be chosen.
Our goal in this research is to compare two most commonly used growth curve models in literature in terms of their prediction precision using growth standards for the US and Turkish pediatric populations.
Materials and Methods
Models and statistical methods
We begin by presenting the two most commonly used growth curves in literature for pediatric growth.
Gompertz function as a growth curve model
In growth curve modeling, Winsor in 1932 introduced the Gompertz function as shown below:
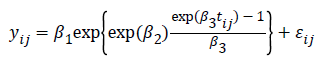
where  is the growth measurement of interest in subject-i at time
  We use
  as the measurement times may be potentially different for each subject [14].
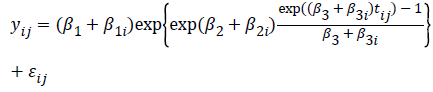
For each of the parameters in the above function, we can assume patient specific random deviation to better fit individual profiles, where the model becomes:
Logistic non-linear as a growth curve model
Lindstrom and Bates in 1990 and Pinheiro and Bates in 1995 proposed the following logistic nonlinear model:
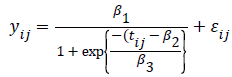
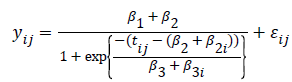
where is the growth measurement of interest in subject-i at time [15]. Similarly as above, we can define patient specific deviation for the other two parameters as well, which results in the following function:
As we see, the logistic function is a simpler function compared to the former, which will make its model fitting computationally much easier.
Both of these functions are non-linear functions and we used the following parameterization for modelling:
None of , and had random effects; that is, each participant had its own individual model fit (Model-0);
Only had a random effect () (Model-1);
Only had a random effect () (Model-2);
Only had a random effect () (Model-3);
Both and had random effects (Model-4);
Both and had random effects (Model-5);
Both and had random effects (Model-6);
All , and had random effects (Model-7)
The first model where none of , and had random effects was fit using classical non-linear regression approach using the NLIN procedure of SAS ® Version 9.4. All remaining seven nonlinear mixed-effects models were fit using the NLMIXED procedure in SAS ® Version 9.4.
From each model, we extracted the predicted value for each anthropometric measurement of interest at a given time point, and its standard error. We then summarized these summary measures across participants to compare the predictive ability of the above-mentioned models.
To compare the prediction characteristics of the above models further, we induced 20% missing data to the growth profiles, fitted the models, and summarized the prediction errors.
Growth data for the US and Turkish populations.
For the US pediatric population, we utilized the growth standards by Center for Disease Control (CDC, https:// www.cdc.gov/growthcharts). These growth standards were originally compiled and proposed in 1977, and then revised in 2000 to address certain issues that the original growth curves proposed in 19771.
For the Turkish pediatric population, we used three data sources:
Data Source-1 (Family Medicine): Growth Charts at https:// www.ailehekimligi.com.tr/?CtrlCustom=HesapOlcum
Data Source-2 (Protective Family): Growth Charts at https:// www.koruyucuaile.gov.tr/cocuk/cocuklarda-yasa-gorebuyume- egrisi-degerleri
Data Source-3 (Ozturk et al.): Growth Curves proposed by Ozturk et al.[13].
From each of these sources, we extracted the growth curves for 3rd, 10th, 25th, 50th, 75th, 90th, and 97th percentiles for the first 3 years of life, and treated these percentiles as ‘individuals’ for modeling and model comparison purposes. In the US growth charts, we had growth measures from birth (0- month) to 36-months in 38 time points. For the Turkish data sources, we had 12, 10, and 13 time points spanning from Birth to 36-months generally having 3-month increment.
As these data on growth curve standards are publicly available and obtained averaging the population of interest, they include no human subject data and no protected health information; therefore, no IRB review was required, and no informed consent process was applicable.
Results
As the parameter estimation process is an iterative process with non-linear models (especially the mixed-effects nonlinear models), converge becomes a major issue especially when model parameterization becomes heavier. In Table 1, we present a converge summary from which we conclude that when more than one-parameter is coupled with its random effect as well (i.e., in Models 4-7), we run into serious convergence issue even with wider initial search grids provided for these models. Therefore, we will focus our attention to Individual-Fit Model (Model-0) and one-random effects models (Model 1-3).
| |
Individual Fit |
β1 as a random factor |
β2 as a random factor |
β3 as a random factor |
β1 and β2 as random factors |
β1 and β3 as random factors |
β2 and β3 as random factors |
β1 and β2 and β3 as random
factors |
| Logistic |
Gompertz |
Logistic |
Gompertz |
Logistic |
Gompertz |
Logistic |
Gompertz |
Logistic |
Gompertz |
Logistic |
Gompertz |
Logistic |
Gompertz |
Logistic |
Gompertz |
| Height |
Family Medicine |
M |
X |
X |
X |
X |
X |
X |
X |
X |
X |
X |
|
|
X |
|
|
X |
| F |
X |
X |
X |
X |
X |
X |
X |
X |
X |
|
|
|
|
X |
|
|
| Protective Family |
M |
X |
X |
X |
X |
X |
X |
X |
X |
|
|
X |
|
|
|
|
X |
| F |
X |
X |
X |
X |
X |
X |
X |
X |
|
|
|
|
|
|
|
|
| Ozturk et al. |
M |
X |
X |
X |
X |
X |
X |
X |
X |
|
|
|
X |
|
|
|
X |
| F |
X |
X |
X |
X |
X |
X |
X |
X |
|
|
|
X |
|
|
X |
X |
| US CDC |
M |
X |
X |
X |
X |
X |
X |
X |
X |
|
X |
|
X |
X |
|
|
X |
| F |
X |
X |
X |
X |
X |
X |
X |
X |
X |
|
|
X |
|
|
|
|
| Weight |
Family Medicine |
M |
X |
X |
X |
X |
X |
X |
X |
X |
|
|
|
|
|
|
|
X |
| F |
X |
X |
X |
X |
X |
X |
X |
X |
|
|
|
|
X |
|
X |
|
| Protective Family |
M |
X |
X |
X |
X |
X |
X |
X |
X |
|
|
|
|
|
|
X |
X |
| F |
X |
X |
X |
X |
X |
X |
X |
X |
|
|
|
|
|
|
X |
X |
| Ozturk et al. |
M |
X |
X |
X |
X |
X |
X |
X |
X |
|
|
|
|
|
|
X |
X |
| F |
X |
X |
X |
X |
X |
X |
X |
X |
|
X |
X |
|
|
|
X |
X |
| US CDC |
M |
X |
X |
X |
X |
X |
X |
X |
X |
|
|
|
|
|
|
X |
X |
| F |
X |
X |
X |
X |
X |
X |
X |
X |
|
|
|
|
|
|
X |
|
Table 1: Model Convergence Summaries (X Represents Models That Had No Convergence Issues. (F: Female, M: Male, US CDC: United States Center for Disease Control).
Individual-fit model gave overall the closest predictions compared Models 1-3, where Model-1 was its best competitor when only the predictions were considered (Table 2).
| |
Logistics |
Gompertz Curve |
Individual
Fit |
β1 as a random factor |
β2 as a random factor |
β3 as a random factor |
Individual
Fit |
β1 as a random factor |
β2 as a random factor |
β3 as a random factor |
| Family Medicine |
Male |
Mean |Residual| |
0.36 |
0.41 |
1.49 |
0.73 |
0.28 |
0.35 |
1.00 |
1.63 |
| Mean SE |
0.53 |
0.17 |
0.64 |
0.33 |
0.43 |
0.15 |
0.44 |
0.68 |
| Female |
Mean |Residual| |
0.54 |
0.55 |
1.42 |
0.90 |
0.50 |
0.53 |
1.38 |
2.01 |
| Mean SE |
0.90 |
0.41 |
0.63 |
0.56 |
0.85 |
0.40 |
0.69 |
0.92 |
| Protective Family |
Male |
Mean |Residual| |
1.15 |
1.17 |
2.20 |
1.41 |
1.01 |
1.03 |
1.71 |
2.37 |
| Mean SE |
2.05 |
0.58 |
1.05 |
0.71 |
1.82 |
0.52 |
0.78 |
0.98 |
| Female |
Mean |Residual| |
0.90 |
0.93 |
2.05 |
1.08 |
0.77 |
0.81 |
1.51 |
2.22 |
| Mean SE |
1.47 |
0.45 |
1.01 |
0.56 |
1.26 |
0.39 |
0.68 |
0.95 |
| Ozturk et al. |
Male |
Mean |Residual| |
1.04 |
1.04 |
2.34 |
1.30 |
0.89 |
0.89 |
1.36 |
1.79 |
| Mean SE |
1.55 |
0.39 |
0.86 |
0.51 |
1.32 |
0.33 |
0.54 |
0.68 |
| Female |
Mean |Residual| |
0.82 |
0.82 |
2.02 |
1.06 |
0.68 |
0.69 |
1.32 |
1.81 |
| Mean SE |
1.22 |
0.31 |
0.76 |
0.43 |
1.01 |
0.25 |
0.52 |
0.67 |
| US CDC |
Male |
Mean |Residual| |
0.95 |
0.95 |
1.88 |
1.12 |
0.83 |
0.84 |
1.22 |
1.66 |
| Mean SE |
1.30 |
0.23 |
0.45 |
0.29 |
1.14 |
0.20 |
0.31 |
0.39 |
| Female |
Mean |Residual| |
0.82 |
0.83 |
1.72 |
0.99 |
0.71 |
0.72 |
1.16 |
1.62 |
| Mean SE |
1.12 |
0.20 |
0.41 |
0.26 |
0.96 |
0.17 |
0.29 |
0.38 |
Table 2: Comparisons of Model Performance for modeling Height. (US CDC: United States Center for Disease Control).
However, Individual-fit model had much higher standard error of estimates as expected due to the fact that it utilized the growth data of an individual alone, while other models utilized the entire growth data, where individuals were treated as independent clusters. This same conclusion is valid for all data sources and both Logistic and Gompertz-based models. Therefore, we propose Gompertz Model-1 (i.e., the model with Only β1 having a random effect (i.e., β1 + β1i)) as our best model. This is illustrated in Figure 1 as well.
Figure 1: Mean absolute residuals and mean standard error of predictions by data source, gender, and modeling approach for height.
Both Table 2 and Figure 2 also show that Gompertz Model performed much better both in terms of prediction and standard error of predictions.
Figure 2: Mean absolute residuals and mean standard error of predictions by data source, gender, and modeling approach for weight.
We also compared these models in terms of prediction characteristics in the presence of missing data in growth profiles by inducing 20% missing data in each growth profile. The results of these model comparisons under missingness is provided in Figure 3 for height and the results for weight is also in the same direction. As for the full profiles with no missingness, again, Gompertz Model-1 has performed the best among all with missing data as well.
Figure 3: Mean absolute residuals and mean standard error of predictions by data source, gender, and modeling approach for height with 20% missing data in each profile.
Discussion
In generating population level growth curves, pediatric population representing different segment of the general population is followed over time, and the observed data is smoothed using advanced statistical models so that growth percentiles and standardized ratios such as Weight-for-height ratio, etc. can be obtained for the population of interest. Once growth percentiles are generated, they provide a comparison platform to observe changes in growth characteristics of the pediatric population over longer time intervals, say, over decades, as well as to compare a given sub-population or a study cohort with the general population such as comparing a African American pediatric study cohort with the general US populations, or comparing a cohort of autistic children with the general pediatric population.
In finalizing the standard growth curves for a population, it is expected that the choice of model is essential. In this study, we compared two such models using already standardized growth curves by considering those growth curve percentiles as individuals. We have shown that Gompertz Growth Curve model with only the first parameter defined with its random effect (i.e., Model-1) performed the best in both the US and Turkish pediatric populations in all Height, Weight, and Head Circumference growth.
One of the main difficulties of these modeling approaches is the issue of model convergence, especially with the models with more than one random effects. To tackle this issue, we utilized the model estimates from the simpler versions of these more complicated models as much as possible. For example, when we are fitting Model-4 where both beta-1 and beta-2 have their random effects as well, we used the model estimates for Model-1 and Model-2 as initial value of the search grid for Model-4. This was helpful for some cases but not all. Therefore, the complexity of determining a reasonable search grid in parameter estimation of these growth parameters still remains a challenge. However, even when the converge issue is resolved, the resulting prediction and its standard error was never better than those of Model-1, which gives us additional assurance that the proposed model is still the most reasonable. As expected, the convergence issue becomes worse under missingness, which was our experience as well in this study when we induced 20% missingness to each profile. Only the single random-term models were able to have acceptable convergence characteristics, thus, providing stable parameter estimates.
We plan to expand this research to include comparisons of the model under different types of missing data. Here, we are using the term ‘missing data’ loosely in the sense that the actual measurement may not be obtained at the time point targeted. This becomes relevant especially in clinical trials and cohort studies where a growth measure is required so that certain developmental assessments such as energy expenditure can be calculated.
Conclusion
It is common that some study participants may not have anthropometric measurements at every time points predetermined in the study protocol. Generally, the obtained measurements are at a close proximity of the targeted time point; for example, a 2-year weight measurement can be obtained ± 3 months of 2-years, say at 27 months. However, to calculate the 2-year energy expenditure for that particular child, a measure of weight is needed exactly at 24-month, which necessitates that it be predicted for 24-month using all other weight measurements for that child. In such predictions, the choice of the underlying growth models becomes critical and it may even be the case that different growth curve models may perform differently in different populations due to growth diversities. Therefore, this paper provides a working approach to compare such models.
Disclosures
Authors declare that there is no financial relationship or conflict of interest regarding this study. Authors also declares that no financial assistance or funding has been used for this study.
References
- Kuczmarski RJ, Ogden CL, Guo SS, Grummer-Strawn LM, Flegal KM, et al. (2000) CDC Growth Charts for the United States: Methods and development. Vital Health Stat. 246: 1-190.
- Hamill PV, Drizd TA, Johnson CL, Reed RB, Roche AF et al. (1979)Physical growth: National Center for Health Statistics percentiles. Am J Clin Nutr. 32: 607-629.
- Stuart HC, Meredith HV 91946) Use of body measurements in the school health program. Am J Public Health and the Nations Health. 36: 1365-1386.
- Owen GM (1978) The new National Center for Health Statistics growth charts. South Med J. 71: 296-296.
- Owen GM (1973) The assessment and recording of measurements of growth of children: Report of a small conference. Pediatrics. 51: 461-466.
- Hegsted DM, Darby WJ, Filer LJ, Shank RE (1974) Comparison of body weights and lengths or heights of groups of children. Nutr Rev. 32: 284-288.
- Roche AF, McKigney JI (1976) Physical growth of ethnic groups comprising the U.S. population. Am J Dis Child. 130: 62–64.
- Dibley MJ, Goldsby JB, Staehling NW, Trowbridge FL, et al. (1987) Development of normalized curves for the international growth reference: Historical and technical considerations. Am J Clin Nutr. 46: 736–748.
- Dibley MJ, Staehling N, Nieburg P, Trowbridge FL (1987) Interpretation of z-score anthropometric indicators derived from the international growth reference. Am J Clin Nutr. 46: 749–762.
- Graitcer P, Gentry E (1981) Measuring children: One reference for all. The Lancet 318: 297-299.
- Sullivan K, Trowbridge F, Gorstein J, Pradilla A (1991) Growth references. The Lancet 337: 1420-1421.
- Waterlow JC, Buzina R, Keller W, Lane JM, Nichaman MZ et al. (1977) The presentation and use of height and weight data for comparing the nutritional status of groups of children under the age of 10 years. Bull World Health Organ 55: 489-498.
- Ozturk A, Borlu A, Cicek B, Altunay C, Unalan D, et al. (2011) Growth charts for 0-18 year old children and adolescents. Turk J Fam Pract. 15: 112-129.
- Winsor CP (1932) The Gompertz curve as a growth curve. Proc Natl Acad Sci USA.18: 1-8.
- Lindstrom MJ, Bates DM (1990) Nonlinear mixed effects models for repeated measures data. Biometrics 46: 673–687.