Keywords
Sample size; SMART method; Food security survey
Introduction
An adequate sample size is important to avoid sampling biases or errors in making generalizations from random sample [1]. The term ‘adequate’ depends not on the proportion of the population sampled, but the absolute sample size preferred with respect to the population complexity, the researcher’s aim and the statistical manipulation method used in analysis of data [2]. For the purpose of household food security survey, sample size determination is made using probability sampling [3]. The most appropriate sampling technique would be simple random sampling, as each potential sampling units (households) in the entire population has the same opportunity to be selected. For practical reasons, when the population is dispersed in a wide geographical area, systematic random sampling technique may be appropriate [4]. This review article summarizes sample size determination techniques using SMART method. It also highlights important considerations to be made while filling household questionnaire surveys.
Important considerations
In order to determine the sample size, in addition to the study purpose and size of population, the following three criteria are worth considering [5].
a) The precision level: The precision level, usually called the sampling error, is the range the population true value is going to be estimated. This range is frequently stated in percentage points such as ± percent.
b) The level of confidence or risk: The level of confidence or level of risk is established on the basis of the ideas embraced under the Central Limit Theorem. The basic idea of Central limit Theorem is expressed as in a repeatedly sampled population, the average attribute value resulted by the samples is similar to the value of the population.
c) Degree of variability: This refers to the distribution of attributes in the population for the attributes being measured. The greater the heterogeneous the populations, the bigger the sample size required to get a given level of precision. On the other hand, a relatively homogeneous population requires a smaller sample size. For instance, a proportion of 50% indicates a greater variability level than either 30% or 70%. This is due to 30% and 70% show that a large majority do not or do, have possess the attribute of interest. A 0.5 proportion indicates the maximum variability of the population. It is usually used in determining conservative sample sizes, which is the sample size can be greater than if the actual variability of the population attribute was used.
Discussion
SMART recommendation of expressing sample size in terms of children vs. households
The required final sample size can be expressed in two ways, either in a fixed number of households or a quota which is, a fixed number of children. Quota sampling method represents selection of households in a cluster until a certain number of children are reached, irrespective of the visited number of households. For instance, if every cluster has to contain 30 children, many households of neighbouring villages can be visited until this number is reached. In contrast, fixed household method only considers a certain number of households, selected randomly in the field, are visited. In the end, some clusters may have larger number of children than the others, but the total must not be significantly different than the planned number. Therefore, it is the number of households not number of children per cluster, which will be targeted. SMART method recommends fixed household method for three reasons. Firstly, since SMART method uses either simple or systematic random sampling methods, it introduces little bias. Secondly, when children are targeted, other indicators such as food security that requires a household level measurement can be skipped. Finally, both anthropometry and mortality indicators needs to be expressed in the same units; i.e., households [6].
Sample size conversion
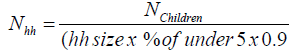
Conversion of number of households from number of children in Equation.1
 (1)
(1)
Where: Nhh=sample size in terms of households
N children=sample size in terms of children
Hh size=average household size
% of under 5=proportion of under 5-old children in the population
0.9=fraction of 6-59 months children within under age 5 category
Precision, accuracy, confidence interval and level of confidence
Precision measures result consistency and related to sampling error, which is the difference between the population value and sample estimate. Sampling error can be controlled by controlling the sampling size [7].
Accuracy determines the estimate validity, and lack of it is associated with bias, that indicates the difference between the estimated sample and the true value of the population due to measurement error, non-representative sample selection or factors other than sample size. Once bias exists, it cannot be controlled. It can be reduced by survey procedures standardization or training survey teams. In conclusion, a larger sample size produces a higher precision of results but can never guarantee the absence of bias. In a very big sample size, quality control could often be difficult and bias can be introduced because large number of teams need to be trained and supervised. Preventing bias is critical in research. One must not try to achieve higher precision at the expense of introducing bias. It might be preferable to have smaller sample size with less precision but much less bias.
By convention, a 95% confidence interval is considered. This indicates that in the absence of bias, once the estimate is at hand, it can be 95% certain (level of confidence) that the true value of the population will be within the limits of the calculated intervals. The more representative the sample, the better accurate measurements, the more certain in the absence of bias and of having the real population value for the indicator within the confidence interval.
Parameters used for sample size determination
Sample size determination depends on the sampling design and the indicator used. Usually, sample size calculation for simple or systematic sampling come up with two numbers:
i) The expected prevalence of the indicator being measured
ii) The extent of confidence to achieve to meaningfully interpret the estimate
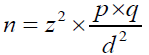
Sample size formula for anthropometry [8] is described in Equation. 2 below:
 (2)
(2)
Where: n=sample size
z=linked to 95% confidence interval (use 1.96)
p=expected prevalence (as fraction of 1)
q=1-p (expected non-prevalence)
d=relative required precision
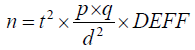
Note that, in cluster sampling, the sample size determined for simple or systematic random sampling will be multiplied by a factor called the design effect to account for clusters heterogeneity. But if one need to undergo cluster survey, it has to come up with a third number.
Sample size formula for anthropometry in cluster design in Equation.3
 (3)
(3)
Where: n=sample size
z=linked to 95% confidence interval for cluster sampling (2.045)
p=expected prevalence (as fraction of 1)
q=1-p (expected non-prevalence)
d=relative required precision
DEFF= Design effect
Non-response rate
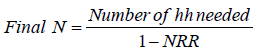
The non-response rate (NRR) represents households that are either absent, inaccessible, refuse to be surveyed, or any other reason for the household to be skipped from being surveyed. In this case the sample size will be determined using the following formula in Equation.4
 (4)
(4)
Example: based on the estimated prevalence, desired precision and design effect, the sample size of households is 555 hh and one expect to have about 6% non-response rate, the final sample size will become:
Final N=555/(1-0.06)=590 hh
Special cases
a) Polygamous families: If in a compound there exists a polygamous family that contains more than one household, each household must be included separately in the list for household selection
b) Impossibility of visiting a household: In many cases when households are unable to be visited due to refusal, conflict, fear of dog etc., the next household shall be visited bases on the sampling procedure, without replacement. In the final sample size determination phase, using the non-response rate method indicated in equation 4, the household not visited shall be considered and planned in the initial stage.
c) Household with no children: In a certain household, if there are only adults available, the questionnaire shall be completed with the rest of respondents and go over to the next household. It must not be replaced. Household exclusion of no children can introduce unnecessary bias.
d) Household absent: During the surveying day, if a household is absent but was available in the previous day, the survey team shall go to the neighbouring household and ask them why this household is empty. Afterwards, the next household needs to be surveyed based on the sampling procedure. The team will return to the absent household before leaving the village. If they are yet absent, it will be reported in the questionnaire but must not be replaced. If more that 5% households are absent in the targeted area, the team shall revisit the area another time.
e) Household abandoned: Households that are abandoned for longer time shall be considered at the preparatory phase and needs to be ignored. Only inhabited households will be considered in the selection process.
f) Child absent: If a child is living in the household but was absent during the survey time, the questionnaire shall be marked and after filling the basic information such as age, sex and feeding practice with the mother or care giver, the team can left the area after informing the respondent that they will return back another time to complete the process. If the child is still unavailable, it shall be recorded as absent but must not be replaced.
g) Disabled child: Disabled children falling in the age of 6-59nmonths are eligible for the survey. However, certain disabilities might not allow to take anthropometric measurements that could lead to bias measures. For instance, weight of a child without limb will not provide reasonable meanings as compared to standard population, while other data such as sex, age, etc., that are not influenced by disability can be recorded.
Conclusion
An adequate sample size is important to avoid sampling biases or errors in making generalizations from random sample in research. For the purpose, SMART method is used. It utilizes either simple or systematic random sampling technique of fixed household method is in sample size determination in food security survey studies increases the validity of the research output.
Larger sample sizes produce higher precision of results but can never guarantee the absence of bias. In a very big sample size on the other hand, quality control could often be difficult and bias can be introduced because large number of teams needs to be trained and supervised. ‘S’ a result, preventing bias is critical in research. One must not try to achieve higher precision at the expense of introducing bias. It might be advisable to have smaller sample size with less precision but much less bias.
References
- Hamed T (2017) Determining sample size; how to calculate survey sample size, Research and development group Malaysia. Int J Econ Manag 2.
- Singh A (2014) Sampling techniques & determination of sample size in applied statistics research: an overview. University of Swaziland, Swaziland.
- Cherns AB (1966) A review of: Survey Sampling. In: KISH L. Ergonomics 9:275-276.
- Ahmed A (2015) Ontological and epistemological assumptions of the survey method. UK Essays 12.
- Michener E (1978) Understanding mathematics. Cognitive Science 2: 361-383.
- Des R (1972)The Design of Sample Surveys. McGraw-Hill Book Company, New York. ISBN-13: 978-0070511552.
- Salant PA, Dillman DA (1994) How to Conduct Your Own Survey: John Wiley & Sons, Inc. New York. ISBN: 978-0-471-01273-3.
- Cochran WG (1963) Sampling Techniques, 2nd Ed. New York: John Wiley and Sons, Inc. 7: 203-203.