Keywords
Percutaneous coronary intervention; Fractional flow reserve; Microvascular; Single vessel disease; Multi vessel disease; Arteries; Intracoronary pressures
Introduction
Despite the existence of more advanced techniques, over 70% of PCI procedures are still performed just by inspection of visual data, without involvement of other techniques [1]. In this traditional PCI practice, not all the relevant visual data are taken into account quantitatively in the coronary stenosis severity assessment (e.g. the lesion length effect). Inter and intra observer experimental radial measurement errors involved in the traditional practice are its well-known downside. Perhaps the most important downside of the traditional PCI practice is the absence of a clear quantitative criterion that indicates when revascularization is mandatory and when medical therapy alone is a sufficient treatment.
About 20 years ago a group of researchers in cardiology came up with an ingenious approach to coronary stenosis severity assessment. Rather than focusing on the morphology of the stenosis itself, they turned their attention to the functional consequences of the stenosis. They introduced the FFR stenosis severity index which is defined as the remnant blood flow Qs through a single stenotic artery relative to the presumable flow Qo through that artery in its previous non-stenotic state, under conditions of minimal microvascular resistance [2]. They achieved minimal epicardial and microvascular resistances by pharmacologically inducing hyperemia in the coronary arteries for the duration of the intracoronary pressure measurements.
FFR = Qs/Qo (1)
Where,
Qo - blood flow through the virtually non-stenotic single artery
Qs - blood flow through the stenotic single artery
FFR was first introduced as a simple basic single-artery stenosis assessment index. In the case of a single vessel disease (SVD) with just one stenosis and the aortic pressure on the proximal side of a stenosis, FFR is termed the true FFR (denoted FFRtrue). FFRtrue of an end artery under such conditions is obtained from numerical values of intracoronary pressure measurements and it is also related to the stenotic and microvascular resistances associated with the artery under consideration [2]:
FFRtrue= Pd/Pa = 1/(1+Rs/Rmv) (2)
Where,
Pa - mean aortic driving pressure proximal to stenosis
Pd - mean pressure distal to stenosis
Rs - stenotic resistance
Rmv – microvascular resistance
It was experimentally established [3] that stenotic arteries with FFR<0.75 should be treated by revascularization whereas the ones with 0.853].
The FFR method is superior to the traditional visual angiographic inspection method in forming revascularization decisions in cases of coronary stenosis. This has been established in the FAME statistical study [4]. However the simple basic single-artery FFR method strangely, without the ability to cope with trans-arterial stenosis-stenosis interaction, emerged from that study as the 'Gold Standard' for coronary stenosis severity assessment in multi vessel disease (MVD) cases. A close look at the description of the FAME study reveals that only the simplest MVD cases were chosen for that study. In each of these cases there were at least two stenoses ≥ 50% in 2 or 3 major epicardial coronary arteries (RCA, LAD, LCx). Cases with LMCA disease were excluded from the study [4], thus exposing LAD and LCx arteries to the aortic pressure. Under these circumstances each of the MVD cases studied in FAME was actually a 'collection' of basic SVD cases and the stenotic major arteries could be treated separately, each one as a simple SVD case. In each one of those cases the mean aortic pressure was maintained all the way to the location of the stenosis (disregarding justifiably the relatively low geometrical viscous resistance of the artery itself) and the basic FFR formula, FFR = Pd / Pa, could be used. In the configurations of stenoses considered in FAME, a stenosis does not affect the blood flow in a neighboring artery. It affects only the blood flow in its own artery which is consequently independent of the blood flow in any other artery, a classical SVD case.
Despite the obvious virtue of the FFR approach, of measuring direct functional consequences of the stenosis, the FFR method has also a downside. The hyperemia associated with the FFR method makes patients feel uncomfortable during the intracoronary pressure measurements and the monetary aspects of the FFR method (cost of equipment and personnel training) are also part of its downside [5]. In recent years a new hyperemiafree FFR method has been developed and studied extensively. It's the instantaneous fractional flow reserve (iFR) method in which the intracoronary pressure measurements are limited to the period of the temporal minimum of the microvascular resistance during part of the diastole in which the microvascular resistance is minimal and stable [6]. Unless otherwise stated or implied, it will be assumed that conditions of stable minimal microvascular resistance apply in all the arterial scenarios under consideration in this article. It will be also assumed throughout the article that there is no direct effect of possible collateral circulation involved with the arterial configurations described herein. Indirectly, collaterals to the distal segment of an artery raise the distal intravascular pressure resulting in increase of the FFR of an artery. In this article, only localized stenoses (ordinary and diffuse) will be considered, diffuse stenosis involving the whole length of an artery will not be considered.
In view of the inability of the basic single-artery FFR method to cope with stenosis-stenosis interactions between neighboring arteries, in 2015 the Multi-artery FFR method was developed [7] in order to improve the current FFR method and adapt it to the general MVD arena in which trans-arterial stenosis-stenosis interactions are not negligible. The method does not relate directly nor contradicts any conclusions of single-artery clinical statistical studies aimed at determining the exact extent of the various FFR treatment decision ranges ('mandatory revascularization' range, 'gray' uncertainty range and 'medical therapy only' range). Applications of Multi-artery FFR method to some numerical examples of resolving 3-artery [LMCA]-[LAD]-[LCx] configurations with stenotic LMCA and with just one stenotic end artery (LAD or LCx) were presented [7]. It turned out that the resolution of such stenotic sizable 3-artery configurations can be conveniently obtained during the PCI procedure from 3 pre-calculated tables of the actual FFR (denoted FFRreal) of each of the 3 arteries [7]. Also, the FFRreal formulas showed dependence on the ratio δ between the microvascular resistances associated with the two end arteries of the configuration, δ = R3mv / R2mv (R3mv and R2mv are the microvascular resistances associated with the stenotic and non stenotic downstream end arteries respectively). In those numerical examples δ was taken to be δ=1. The dependence on δ (= R3mv/R2mv) of the FFRreal formula of each artery of the configuration, obtained by the Multi-artery FFR method, has initially casted some shadow on the practicability of the method. In the formulas of FFRreal of each artery the actual value of the δ of the particular 3-artery configuration under consideration in the PCI procedure has to be taken into account, not a statistical mean value of δ. δ however varies from one 3-artery configuration to another and therefore also from one patient to the next, which may render the method impractical (no practitioner would have wanted elaborate angiographic measurements and calculations combined with intracoronary pressure measurements within the same PCI procedure). The δ issue has been therefore explored numerically [8] and it turned out that in stenotic 3 artery configurations of sizable coronary arteries (LMCA, LAD, LCx, RCA and occasionally sizable D1, M1 etc.), in typical examples within ordinary range of statistical variation of morphology (radii, rates of tapering and lengths) [9] with δ being in the range 0.6< δ <1.7 (note that the intracoronary pressures in the appropriate examples are identical, for comparison purposes [7,8]) the FFRreal values for the individual arteries exhibit acceptable variations of just ± 0.02 within the specified range of δ in the low and intermediate FFR stenosis severity ranges [8]. It should be noted that in estimating the numerical δ practical range, it was taken into account that the end arteries may switch 'roles' namely if in one example LAD is stenotic and LCx is not then δ= δ1. If a 'mirror' example is considered, namely if LCx is stenotic and LAD is not then δ=δ2=1/δ1. Since the δ values are in the proximity of δ=1 and since FFRreal of each artery is practically invariant with respect to δ in the range 0.6<δ<1.7 , then the 3 tables of FFRreal of each artery (pre-calculated for δ=1 with a FFRtrue of scale resolution of ΔFFR=0.02 in each table [7]) can be used for immediate resolution of a stenotic 3-artery configuration of sizable arteries (with a stenotic conductance artery and with just one stenotic end artery while the other is stenosis-free) during a PCI procedure. It should be noted that the primary driving pressure of the 3-artery configuration assessed by the Multi-artery FFR method should be very close to the mean aortic pressure. If for instance the '3-artery' configuration is effectively the (proximally stenotic LAD)-(sizable stenotic D1)-(non stenotic remainder of LAD) then the LMCA preceding this 'configuration' should be stenosisfree so that the aortic pressure is maintained all the way to the beginning of LAD.
The main aim of the present article is two-fold. Firstly, to apply the Multi-artery FFR method for resolving 3-artery configurations of sizable coronary arteries in which all arteries are stenotic (including both end arteries) and considerable stenosis-stenosis interactions play an important role. Secondly, despite the lengthy mathematical analysis, to put into the hands of the PCI practitioner user-friendly simple mathematics so that all the needed mathematics can be applied by the practitioner in real time during the PCI procedure.
Materials and Methods
Resolution of all-stenotic coronary 3-artery configuratiations of sizable arteries
The 3-artery configuration dealt with in this section will be the one that is schematically presented in Figure 1 of the introductory article of Multi-artery FFR [7]. In the present article however all 3 arteries of the configuration in Figure 1 are stenotic, the functionally conductance artery (Artery 1) as well as both end arteries (Artery 2 and Artery 3). Such 3-artery configurations are not less common than the ones with just one stenotic end-artery (Artery 2 or Artery 3 of Figure 1) [10]. The 3-artery configuration constitutes the connection between the mean aortic high pressure Pa and the venous bed low pressure Pv≈0. Arteries 2 and 3 of Figure 1 are connected in a parallel connection, preceded by Artery 1 which is connected to them in series. Using analog electricity rules for obtaining the equivalent resistance of resistors connected in parallel and resistors connected in series, the magnitude of blood flow through each artery can be calculated and the mean pressure at points of interest can be determined.
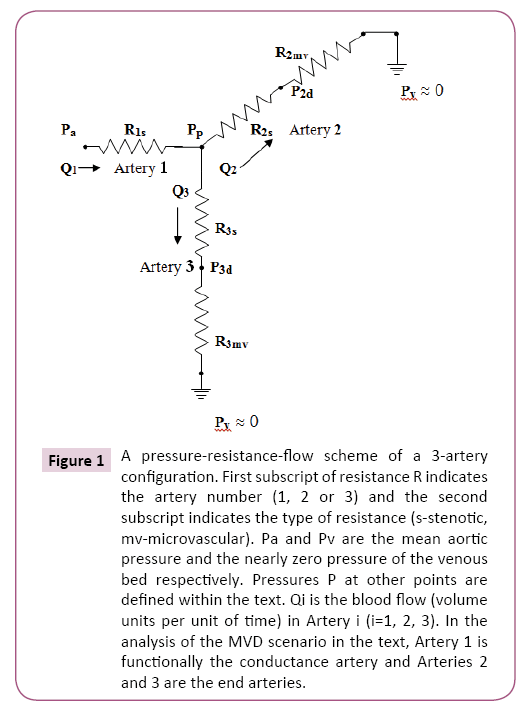
Figure 1: A pressure-resistance-flow scheme of a 3-artery configuration. First subscript of resistance R indicates the artery number (1, 2 or 3) and the second subscript indicates the type of resistance (s-stenotic, mv-microvascular). Pa and Pv are the mean aortic pressure and the nearly zero pressure of the venous bed respectively. Pressures P at other points are defined within the text. Qi is the blood flow (volume units per unit of time) in Artery i (i=1, 2, 3). In the analysis of the MVD scenario in the text, Artery 1 is functionally the conductance artery and Arteries 2 and 3 are the end arteries.
Calculations yield the following expressions for the pressures at the appropriate points in Figure 1:
Pp = Pa/ { (R1s/R3mv)/[1+(R3s/R3mv)] + (R1s/R2mv)/[1+(R2s/R2mv)] +1 } (3)
P2d = Pa/{ (R1s/R2mv) + (R2s/R2mv) +1 + [(R1s/R3mv)/[(R3s/R3mv) +1]âˆÂââ€Å¾Â¢[(R2s/ R2mv)+1] } (4)
P3d = Pa/{ (R1s/R3mv) + (R3s/R3mv) +1+ [(R1s/R2mv)/[(R2s/R2mv) +1]âˆÂââ€Å¾Â¢[(R3s/ R3mv)+1] } (5)
In the various resistances Rjk in these expressions the first index indicates the Artery number j=1,2,3 while the second index k indicates the kind of resistance, stenotic (s) or microvascular (mv).
It can be seen that the above expressions are actually functions of the following 4 variables: R1s/R2mv, R1s/R3mv, R2s/R2mv and R3s/R3mv.
The Pp, P2d and P3d expressions can be eventually written as functions of FFRtrue (1), FFRtrue (2), FFRtrue (3) and δ. It should be stressed that in this section that deals with sizable coronary arteries the numerical value of δ will be taken as δ=1 [8]. The FFRtrue terms are the familiar ones from the basic single-artery FFR method:
FFRtrue (1) = 1/[(R1s/R2mv) + (R1s/R3mv) + 1] (6)
FFRtrue (2) = 1/[1 + (R2s/R2mv)] (7)
FFRtrue (3) = 1/[1 + (R3s/R3mv)] (8)
It should be noted however that FFRtrue is the basic FFR of a stenotic artery when all other arteries are virtually stenosis-free but in the arterial configurations considered in this article the reality is usually different, all their arteries are stenotic. Flows of stenotic arteries interact (termed stenosis-stenosis interaction) and the numerical FFR values of arteries change. The actual FFR of an artery in such cases is denoted in this article by FFRreal and it is no longer equal to FFRtrue. The FFRtrue terms in the Multi-artery FFR method serve as auxiliary variables on which the FFRreal of the arteries of the configuration (and intracoronary pressures) depend [7,8]. There is also FFRreal dependence on δ,
δ = R3mv/R2mv (9)
At this point it should be noted that the FFRreal of each artery of the configuration can be also expressed directly in terms of the measured intracoronary pressures Pa, P2d, P3d and Pp. This can readily yield the current numerical values of FFRreal of each artery and reflect the current status of the configuration. However, the expression of the FFRreal of each artery as a function of FFRtrue (1), FFRtrue (2) and FFRtrue (3) is also vital because of its usefulness when a prospective revascularization of an artery is considered. If the effect of prospective revascularization of an artery is sought, one puts FFRtrue=1.00 for the revascularization candidate artery into the expression for FFRreal of each of the arteries of the configuration in turn (maintaining the FFRtrue of each of the other arteries at their current values), in order to see the possible effect of revascularization. It should be noted however that FFRtrue=1.00 represents an ideal outcome of a revascularization, in reality it may be somewhat less.
The terms (R1s/R2mv) and (R1s/R3mv) participating in the (3), (4) and (5) expressions, can be obtained from equations (6) and (9):
R1s/R2mv = [δ/(1+ δ)][1- FFRtrue (1)]/ FFRtrue (1) (10)
R1s/R3mv = [1/(1+ δ)][1- FFRtrue(1)]/ FFRtrue (1) (11)
Using these expressions, Pp assumes the following form
Pp=Pa/{[1- FFRtrue (1)]/ FFRtrue (1){[1/(1+ δ)] FFRtrue (3)+[δ/(1+δ)] FFRtrue (2)}+1} (12)
Using the expression for P3d from the introductory article of the Multi-artery FFR [7] and equations (10) and (11) of the present article, one gets:
P3d=Pa/{{[1-FFRtrue (1)]/[(1+δ) FFRtrue (1)]}âˆÂââ€Å¾Â¢[1+δâˆÂââ€Å¾Â¢FFRtrue (2)/ FFRtrue (3)]+1/FFRtrue (3)} (13)
P2d can be obtained in a similar way, by expressing resistances in terms of FFRtrue (i) , i=1, 2, 3 and δ, but it can be obtained also from expression (13) of P3d by interchanging indices 2 and 3 which also implies replacing δ by 1/ δ (see expression (9) ) in expression (13):
P2d= Pa/{{[1- FFRtrue (1)]/[(1+δ)âˆÂââ€Å¾Â¢ FFRtrue (1)]}âˆÂââ€Å¾Â¢[δ+ FFRtrue (3)/ FFRtrue (2)]+1/ FFRtrue (2)} (14)
In the following the numerical resolution process of the stenotic 3-artery configuration will be described. In the coming expressions, we'll use the following notations:
Qi (o) - flow through artery i (i=1, 2, 3) when all arteries are virtually stenosis-free
Qi (s) – flow through artery i (i=1, 2, 3) in all-stenotic 3-artery configuration
FFRtrue (i) - FFRtrueof artery i (i=1,2,3)
FFRapp (i) - apparent FFR of artery i (i=1,2,3)
FFRreal (i) - actual FFR of artery i (i=1,2,3)
In the first stage of the resolution process, the current values of the FFRapp, FFRtrue and FFRreal of all the arteries of the configuration are calculated from the measured values of the intracoronary pressures at the designated points (Figure 1).
Figure 1: A pressure-resistance-flow scheme of a 3-artery configuration. First subscript of resistance R indicates the artery number (1, 2 or 3) and the second subscript indicates the type of resistance (s-stenotic, mv-microvascular). Pa and Pv are the mean aortic pressure and the nearly zero pressure of the venous bed respectively. Pressures P at other points are defined within the text. Qi is the blood flow (volume units per unit of time) in Artery i (i=1, 2, 3). In the analysis of the MVD scenario in the text, Artery 1 is functionally the conductance artery and Arteries 2 and 3 are the end arteries.
The two end arteries 2 and 3 (Figure 1) will be considered first, in order to obtain their FFRtrue numerical values. From Figure 1 it can be seen that:
FFRapp (i) = Pid/Pp (i=2,3) (15)
Pp = Qi (s)âˆÂââ€Å¾Â¢(Ris+Rimv) (i=2,3) (16)
Pid = Qi (s)âˆÂââ€Å¾Â¢Rimv (i=2,3) (17)
FFRapp(i) = [Qi (s)âˆÂââ€Å¾Â¢Rimv] / [Qi (s)âˆÂââ€Å¾Â¢(Ris+Rimv)]=1/(1+ Ris/Rimv)=FFRtrue(i) (i=2,3) (18)
In the scenario of Figure 1 the numerical values of FFRtrue for the end arteries (i=2,3) are therefore given by:
FFRtrue(i) = Pid / Pp (i=2,3) (19)
Turning to the functionally conductance Artery 1 of Figure 1, one has
FFRapp (1) = Pp / Pa (20)
Using equations (12) and (19), one gets
FFRtrue (1) = 1/{[(Pa-Pp)âˆÂââ€Å¾Â¢(1+ δ)]/(P3d+ δâˆÂââ€Å¾Â¢P2d) + 1} (21)
Now the actual value of FFR (namely FFRreal) of each of the 3 arteries in Figure 1 will be obtained.
FFRreal (1)=Q1 (s)/Q1 (o)=[(Pa-Pp)/R1s]/[(Pa/R2mv)+(Pa/R3mv)] (22)
Using equations (6) and (21) one gets:
FFRreal(1)=(P3d + δâˆÂââ€Å¾Â¢P2d)/[PaâˆÂââ€Å¾Â¢(1+ δ)] (23)
From this equation the current numerical value of FFRreal(1) can be readily obtained from the measured intracoronary pressures Pa, P2d and P3d taking into account that δ is taken to be δ=1.
In the second stage of the resolution process, FFRreal of each artery of the configuration is expressed in terms of the auxiliary variables FFRtrueof the arteries of the configuration. These FFRreal expressions are useful when the outcomes of possible revascularizations of the arteries of the configuration are evaluated.
Let's derive now FFRreal(1) in terms of the auxiliary variables FFRtrue (1), FFRtrue (2), FFRtrue (3) and δ. This can be done by putting expressions (13) and (14) (for P3d and P2d respectively) and δ=1 into expression (23):
FFRreal(1)={ FFRtrue (1)âˆÂââ€Å¾Â¢[ FFRtrue (3)+δâˆÂââ€Å¾Â¢FFRtrue (2)] } / { [1- FFRtrue (1)]âˆÂââ€Å¾Â¢[δâˆÂââ€Å¾Â¢FFRtrue (2) + FFRtrue (3)] + [(1+δ)âˆÂââ€Å¾Â¢ FFRtrue (1)]} (24)
In order to obtain the expressions for FFRreal(2) and FFRreal(3), Qi (o) and Qi (s) (i=2,3) need to be expressed first:
Qi (o) = Pa / Rimv (i=2, 3) (25)
Qi (s) = Pid / Rimv (i=2,3) (26)
These expressions yield the current actual FFR numerical values FFRreal of the end arteries 2 and 3 in Figure 1:
FFRreal(i) = Qi (s) / Qi (o) = Pid / Pa (i=2,3) (27)
The current numerical value of FFRreal(i) (i=2,3) can be therefore readily obtained from the measured intracoronary pressures P2d, P3d and Pa.
FFRreal(2) and FFRreal(3) can be expressed in terms of the auxiliary variables FFRtrue (1), FFRtrue (2), FFRtrue (3) and δ. This can be done by putting expressions (13) and (14) (for P3d and P2d respectively) and δ (δ=1) into expressions (27):
FFRreal(2)= P2d / Pa = [(1+ δ)âˆÂââ€Å¾Â¢ FFRtrue (1)âˆÂââ€Å¾Â¢ FFRtrue (2)] / { [1-FFRtrue(1)]âˆÂââ€Å¾Â¢[δâˆÂââ€Å¾Â¢FFRtrue (2) + FFRtrue (3)] + (1+ δ)âˆÂââ€Å¾Â¢ FFRtrue (1)} (28)
FFRreal(3)= P3d / Pa = [(1+ δ)âˆÂââ€Å¾Â¢ FFRtrue (1)âˆÂââ€Å¾Â¢ FFRtrue(3)] / { [1- FFRtrue (1)]âˆÂââ€Å¾Â¢[δâˆÂââ€Å¾Â¢FFRtrue (2) + FFRtrue (3)] + (1+ δ)âˆÂââ€Å¾Â¢ FFRtrue (1)} (29)
It is evident that FFRreal (1), FFRreal (2) and FFRreal (3) have a common denominator (expressions (24), (28) and (29)). This will prove useful by shortening the data processing time when prospective revascularization outcomes are evaluated in PCI procedures.
Results
It has been shown that the multi-artery FFR method yields results of acceptable accuracy (Δ FFRreal = ± 0.02) in cases of low and intermediate stenosis severity [8]. Since the intermediate stenosis severity range is the most uncertain range for making right treatment decisions (revascularization or just medical therapy), the numerical examples presented in this article will be the ones that apparently seem to be in the proximity of this range. In the low-severity and high-severity ranges the treatment decision is obvious just by visual inspection of data and the application of other methods is usually not needed.
Regarding the examples presented in the following, it should be stressed again that depending on circumstances, revascularization of arteries is not always fully successful. It will be nevertheless assumed in this article that an artery gains FFRtrue=1.00 by the act of revascularization.
In this section dealing with sizable coronary arteries, δ will be taken as δ=1 [7,8]. The 3-artery configurations will closely follow the scheme of Figure 1.
Example #1: [stenotic LMCA]-[stenotic LCx]-[stenotic LAD]
By Figure 1: Artery 1 = LMCA Artery 2 = LCx Artery 3 = LAD
In this example we'll consider stenotic arteries the FFRreal of which are close to the upper end of the FFR uncertainty range.
The measured intracoronary mean pressures at the appropriate points of Figure 1:
Pa = 100 mmHg
Pp = 90 mmHg
P2d = 85 mmHg
P3d = 80 mmHg
LMCA:
FFRapp (1) = Pp/Pa = 0.90 (by formula (20) )
FFRtrue (1) = 0.89 (by formula (21) )
FFRreal(1) = 0.83 (by formula (23) )
LCx:
FFRtrue (2) = P2d/Pp = 0.94 (by formula (19) )
FFRreal(2) = P2d/Pa = 0.85 (by formula (27) )
LAD:
FFRtrue (3) = P3d/Pp = 0.89 (by formula (19) )
FFRreal(3) = P3d/Pa = 0.80 (by formula (27) )
Despite the first impression from FFRapp(1)=0.90, the FFRreal of all 3 arteries of the configuration are lower than FFRapp(1) and in the proximity of the upper end of the uncertainty range 0.75 ≤ FFR ≤ 0.85. Let's consider a case of an unprotected LMCA and try to improve its FFRreal by revascularization of LAD or LCx or of both these arteries:
Revascularization of LCx (Artery 2 in Figure 1):
FFRtrue (1)=0.89 FFRtrue (2)=1.00 FFRtrue(3)=0.89
This yield:
FFRreal(1) ≈ 0.85 (by expression (24) )
FFRreal(2) ≈ 0.90 (by expression (28) )
FFRreal(3) = 0.80 (by expression (29) )
This revascularization results in minor improvement of FFRreal (1) and FFRreal (2).
It should be noted that this revascularization transforms the 3-artery configuration in principle into the 3-artery configuration of the introductory article of Multi-artery FFR [7] in which the LCx artery is stenosis-free (Figure 1 with R2s=0 therein). The 3 tables there that correspond to δ=1 can be justifiably used to obtain the FFRreal values of the arteries here after revascularization [7]. The values of FFRtrue (1)=0.89 and FFRtrue (3)=0.89 here should be used with those tables in order to obtain FFRreal of each of the arteries of the 3-artery configuration after revascularization here. The FFRtrue scale resolution of those tables is greater than Δ FFRtrue =±0.02 therefore interpolation needs to be used in order to obtain the FFRreal from the tables [7]. FFRreal (1) ,FFRreal (2) and FFRreal (3) are obtained from tables respectively [7]. The agreement of these tabular results with the FFRreal values resulting from the revascularization here is excellent.
Let's turn now to the revascularization of LAD (Artery 3 in Figure 1):
FFRtrue (1)=0.89 FFRtrue (2)=0.94 FFRtrue (3)=1.00
This yield:
FFRreal(1) ≈0.87 (by expression (24) )
FFRreal(2) =0.84 (by expression (28) )
FFRreal(3) ≈0.89 (by expression (29) )
Note that the tables of the introductory article of Multi-artery FFR [7] can be used here as well in order to obtain the FFRreal values of each of the arteries of the 3-artery configuration. In that article LCx is stenosis-free and it is denoted Artery 2 in Figure 1 therein. Therefore in order to use the tables there, one should virtually interchange the arteries LAD and LCx here because the revascularization of LAD here makes LAD the stenosis-free artery. The virtual interchange does not lead to a contradiction because δ is taken to be δ=1. Nevertheless, it seems that virtual interchange of arteries may be confusing to the practitioner and might lead to mistaken identification of arteries. It would be therefore preferable to obtain the revascularizations results just by the formulas developed in the present article. Furthermore, note that expressions (24), (28) and (29) share a common denominator, therefore in each revascularization case the calculation of FFRreal (1), FFRreal (2) and FFRreal (3) is quick and can be done by the practitioner in real time during the PCI procedure.
Revascularization of both LCx and LAD (Arteries 2 and 3 respectively in Figure 1):
FFRtrue (1)=0.89 FFRtrue (2)= FFRtrue (3)=1.00
The revascularization of both LCx and LAD end arteries leaves a simple scenario of just a single stenotic LMCA artery with:
FFRreal (1) = FFRtrue (1) = 0.89 (this is also in accordance with formula (24))
FFRreal (2) = FFRtrue (1) = 0.89 (by formula (28))
FFRreal (3) = FFRtrue (1) = 0.89 (by formula (29))
It should be noted that the revascularization of both end arteries does not yield results that are a lot better than the revascularization of just the LAD artery.
At this stage it seems that the most significant FFRreal improvement to the arteries of the configuration by a single artery revascularization would be by revascularizing the LAD artery. However the improvement would not be dramatic since the FFRreal of the arteries remain in the proximity of the upper end of the FFRreal uncertainty range.
Since LMCA in this case is taken as unprotected, its revascularization is actually a CABG operation which has its own risks. This would expose LAD and LCx to the aortic pressure and therefore in such a case one has
LCx: FFRreal (2)= FFRtrue (2)=0.94
LAD: FFRreal (3)= FFRtrue (3)=0.89
As for LMCA, expression (24) can be used with
FFRtrue (1)= 1.00 FFRtrue (2)= 0.94 FFRtrue (3)= 0.89
This yields:
FFRreal (1) ≈ 0.92 (by expression (24) )
Surprisingly the outcome of a CABG operation of LMCA is not a lot better than the one obtained by revascularizing just LAD.
In conclusion of this Example #1, it seems that it would be best for the practitioner to take into account also other particular clinical data concerning the patient under consideration, prior to reaching the final decision regarding revascularization.
Example 2: [stenotic proximal LAD]-[stenotic remainder of LAD]- [stenotic sizableD1]
In this example a stenotic LAD artery (with two stenoses, one preceding and the other following the D1 split-off point) with a sizable stenotic diagonal side branch D1 is described in Figure 1 by an equivalent '3-artery' configuration:
Artery 1 = stenotic proximal LAD
Artery 2 = stenotic remainder of LAD
Artery 3 = stenotic sizable diagonal D1
It should be noted that in this example LMCA is stenosis-free so that the aortic pressure is maintained all the way to the beginning of LAD. Also, occasionally D1 happens to be a sizable artery and the arterial configuration in this example represents such a case.
It should be also noted that the microvascular resistance associated with the remainder of LAD here (Artery 2 in Figure 1) is nearly equal to the microvascular resistance associated with the whole LAD artery so that the LAD virtual dissection effect (namely removal of the proximal part of LAD from δ calculation) on δ is negligible. δ therefore is still in the proximity of δ=1 in this example and the appropriate formulas can be used with δ=1 (see also Example #1 with sizable D1 in another article [8]).
In this example we'll consider stenotic arteries the FFRreal values of which are close to the lower end of the FFR uncertainty range.
The measured intracoronary mean pressures at the appropriate points of Figure 1 are taken to be:
Pa = 100 mmHg
Pp = 80 mmHg
P2d = 70 mmHg
P3d = 75 mmHg
Stenotic proximal LAD:
FFRapp(1) = Pp/Pa = 0.80 (by formula (20) )
FFRtrue (1) = 0.78 (by formula (21) )
FFRreal (1) ≈ 0.73 (by formula (23) )
Stenotic remainder of LAD:
FFRtrue (2) = P2d/Pp ≈ 0.88 (by formula (19) )
FFRreal (2) = P2d/Pa = 0.70 (by formula (27) )
Stenotic sizable diagonal D1:
FFRtrue (3) = P3d/Pp = 0.94 (by formula (19) )
FFRreal (3) = P3d/Pa = 0.75 (by formula (27) )
The FFRreal numerical values of both LAD parts and the sizable diagonal artery D1 are not satisfactory. In the following it will be seen if appropriate revascularizations can sufficiently improve the FFRreal of the arteries of the configuration.
Revascularization of stenotic proximal LAD (Artery 1 in Figure 1): FFRtrue (1)=1.00 FFRtrue (2)≈0.88 FFRtrue (3)=0.94
This yield:
FFRreal (1) =0.91 (by expression (24) )
FFRreal (2) ≈0.88 (by expression (28) )
FFRreal (3) =0.94 (by expression (29) )
The outcome is very good. Note that the revascularization of Artery 1 exposes Artery 2 and Artery 3 to the aortic pressure and each can exploit fully its current potential: FFRreal (2)= FFRtrue (2) and FFRreal (3)= FFRtrue (3). However, we'll proceed to the other revascularization possibilities in order to see if there is still a better result, preferably a single artery revascularization as well.
Revascularization of stenotic remainder of LAD (Artery 2 in Revascularization of stenotic remainder of LAD (Artery 2 in Figure 1):):
FFRtrue (1)=0.78 FFRtrue (2)=1.00 FFRtrue (3) = 0.94
This revascularization yields:
FFRreal (1) =0.76 (by expression (24))
FFRreal (2) ≈0.79 (by expression (28))
FFRreal (3) =0.74 (by expression (29))
The results of this revascularization show just a minor improvement of the FFRreal values. Note also that the revascularization transforms the 3-artery configuration in principle into the 3-artery configuration of the introductory article of Multi-artery FFR [7] in which Artery 2 is also stenosisfree (Figure 1 with R2s=0 therein). The 3 tables of that article that correspond to δ=1 can be used to obtain the FFRreal values of the arteries here after revascularization. The values of FFRtrue (1)=0.78 and FFRtrue (3)=0.94 here can be used by interpolation in those tables in order to obtain FFRreal of each of the arteries of the 3-artery configuration after revascularization. FFRreal (1) , FFRreal (2) and FFRreal (3) are obtained from tables respectively of that article. The obtained tabular results agree excellently with the FFRreal values resulting from the revascularization here.
Revascularization of stenotic sizable diagonal D1 (Artery 3 in Figure 1):
FFRtrue (1)=0.78 FFRtrue (2)≈0.88 FFRtrue (3) = 1.00
The revascularization results are:
FFRreal (1) =0.74 (by expression (24))
FFRreal (2) =0.69 (by expression (28))
FFRreal (3) =0.79 (by expression (29))
These results exhibit minor changes compared to the current FFRreal values of the arteries of the configuration. Although the experimental error in the proximity of δ=1 is Δ FFRreal = ± 0.02 [8], the revascularization of D1 has worsened FFRreal (2) (at least theoretically) from 0.70 to 0.69. This has taken place bearing in mind the competition in the background between the flows of Artery 2 and Artery 3 (Figure 1). Although the improvement of FFRreal (3) (from 0.75 to 0.79) comes essentially due to the revascularization of Artery 3, it slightly does affect also FFRreal(2).
Other possible revascularizations in the following involve 2 artery segments.
Let's carry out a revascularization of the LAD artery (both Artery 1 and Artery 2 of Figure 1 of this article):
FFRtrue (1)= FFRtrue (2)=1.00 FFRtrue (3)=0.94
Such a revascularization yields the following results:
FFRreal (1) =0.97 (by expression (24))
FFRreal (2) =1.00 (by expression (28))
FFRreal (3) =0.94 (by expression (29))
The results are very good but they required the removal of 2 stenoses, not just 1. Note that the revascularization of Artery 1 exposed Artery 3 to the aortic pressure and therefore FFRreal (3)= FFRtrue(3).
Now a simultaneous revascularization of Artery 1 (proximal LAD) and Artery 3 (diagonal D1) will be tried:
FFRtrue (1)= FFRtrue (3)=1.00; FFRtrue (2) ≈ 0.88
The following results are obtained:
FFRreal (1) = 0.94 (by expression (24))
FFRreal (2) ≈ 0.88 (by expression (28))
FFRreal (3) = 1.00 (by expression (29))
It should be noted that the revascularization of Artery 1 has exposed Artery 2 and Artery 3 to the aortic pressure. Therefore, FFRreal of each of the 2 arteries is equal to its current FFRtrue, namely FFRreal (2)= FFRtrue (2)≈0.88 and FFRreal(3)= FFRtrue (3)=1.00.
The last 2-artery segments revascularization is the revascularization of Artery 2 and Artery 3:
FFRtrue (2)= FFRtrue (3)=1.00; FFRtrue (1) =0.78
This yields the following results:
FFRreal (1) = 0.78 (by expression (24))
FFRreal (2) = 0.78 (by expression (28))
FFRreal (3) = 0.78 (by expression (29))
The conclusions from evaluating the various revascularization options are that a revascularization of the proximal LAD artery can be very beneficial but depending on circumstances, the practitioner may decide to go for the revascularization of the whole LAD artery that would yield somewhat better results.
Discussion
At its introduction, the Multi-artery FFR method was applied to the stenotic 3-artery configuration of sizable arteries [LMCA]-[LCx]- [LAD] in a numerical example in which LMCA was stenotic and just one of the end arteries (e.g. LAD) was chosen to be stenotic and the other one was stenosis-free [7]. The actual FFR (denoted FFRreal) of each artery was calculated with the microvascular resistance ratio δ = RLADmv / RLCxmv taken to be δ=1 on LAD and LCx morphological statistical grounds [9,11]. As already described, it also turned out that the resolution of such a stenotic 3-artery configuration could be performed by a tabular method to obtain the numerical value of actual FFR (FFRreal) of each of the arteries, employing 3 tables calculated prior to the PCI procedures [7].
realizing that FFRreal of each artery of a 3-artery configuration of a patient cannot depend on a statistically obtained value of δ, rather on the actual value of δ associated with the 3-artery configuration of the patient under consideration, the matter was further explored numerically [8]. It turned out that in stenotic 3 artery configurations of sizable coronary arteries in typical examples within ordinary range of statistical variation of morphology (radii, rates of tapering and lengths) [9] δ is in the range 0.6<δ<1.7 namely in the proximity of δ=1. The FFRreal values for the individual arteries exhibit acceptable variations of just ΔFFRreal =±0.02 within the specified range of δ, in the low and intermediate FFR stenosis severity ranges [8]. In conclusion, the 3 tables corresponding to δ = 1 that were used to resolve the [LMCA]-[LCx]-[LAD] stenotic 3-artery configuration [7] (but modified with a FFRtrue scales resolution refined down to ΔFFRtrue=0.02) can be employed to resolve stenotic 3-artery configurations of sizable arteries with a stenotic functionally conductance artery and just one (out of two) stenotic end artery with the other one being stenosis-free.
In the present article the advantage of using a tabular method for an immediate resolution of stenotic 3-artery configurations of sizable coronary arteries [7,8] is lost. The reason is that under the new circumstances of all 3 arteries of the configuration being stenotic (not just the functionally conductance artery and one end-artery), an additional auxiliary variable, FFRtrue (3), has come into play. Tables are two dimensional and therefore cannot be directly useful in a 3-variable space. When dealing with all-stenotic 3-artery configurations, tables can be only partially useful, especially when some end-artery revascularization options are checked but sometimes the change of artery indices involved in such a process might be confusing to the practitioner and lead to undesirable mistakes. It is therefore preferable to use algebraic expressions (24), (28) and (29) in checking a revascularization option, since they are easy and quick to calculate as they numerically share the same denominator. FFRreal of each artery resulting from revascularization options can be therefore easily checked by the practitioner in real time during the PCI procedure. Of course, this should be preceded by calculating the current FFRreal of each artery by expressions (23) and (27) to assess the condition of the stenotic configuration and verify the need for revascularization.
Regarding the stenosis-stenosis interaction, it is extremely important to draw the reader's attention to the misleading effect that visual inspection might have even on an experienced PCI practitioner. In a simple case of a single stenotic artery with just one stenosis, a practitioner might properly make a stenosis severity assessment. In FFR terminology, by observing the artery the practitioner is actually 'looking' at FFRtrue. In such a simple case FFRreal = FFRtrue. However, if such an artery is part of a stenotic multi-artery configuration, because of inter-arterial stenosis-stenosis interactions, FFRreal ≠ FFRtrue. The practitioner may even calculate the FFRtrue values of all the arteries of the configuration (expressions 19 and 21) but FFRtrue of an artery in a stenotic multi-artery configuration no longer has the meaning that it had in a standalone position. Actually, FFRreal < FFRtrue in all the arteries (prior to revascularization) of the examples. The difference between FFRreal and FFRtrue may be sometimes about 0.20 (!) which seems incredible (the whole width of the FFR uncertainty range is just about 0.10 !). This implies that a stenotic artery that is considered risk-free by the practitioner in a standalone position (e.g. FFRreal = FFRtrue =0.90) may be driven by the inter-arterial stenosis-stenosis interactions even below the FFR uncertainty range (e.g. FFRreal=0.70), although it still keeps its stand-alone FFRtrue =0.90. Inspection of the initial status (prior to revascularization) of some of the arteries in the examples might be quite educational in this respect. The multi-artery FFR method however yields FFRreal of all the arteries of the configuration for the practitioner and evades pitfalls.
Conclusion
The Multi-artery FFR method has advanced considerably during recent years. This article marks an important milestone on its road to widespread use. It provides the exact resolution of all-stenotic 3-artery coronary configurations and presents outcomes of possible revascularizations in the individual patient in which all 3 arteries of the configuration are stenotic and the stenosis-stenosis interactions are not necessarily negligible. The basic single artery FFR method has not been designed to cope with trans-arterial stenosis-stenosis interactions nor can approximations based on it be used successfully to this end.
Last but not least, although the tabular method that yields immediate answers in cases of 3-artery configurations having two stenotic arteries (the functionally conductance artery and one end-artery) [7,8] cannot be used directly in the resolution of all-stenotic 3-artery configurations, the appropriate formulas and other mathematical expressions in this article that yield the optimal resolution of all-stenotic 3-artery configurations are simple and can be used by the practitioner in real time during the PCI procedure.
References
- Fornell D (2013) Despitepotential impact, use remains low for fractional flow reserve (FFR). Diagnostic and Interventional Cardiology.
- Pijls NH, van Son JA, Kirkeeide RL, De Bruyne B, Gould KL(1993) Experimentalbasis of determining maximum coronary, myocardial, and collateral blood flowby pressure measurements for assessing functional stenosis severity before andafter percutaneous transluminal coronary angioplasty. Circulation87:1354-1367.
- Petraco R, Sen S, Nijjer S, Echavarria-Pinto M, Escaned J, et al. (2013) Fractional flow reserve-guided revascularization-practical implications of a diagnostic gray zone and measurement variability on clinical decisions. J Am CollCardiolIntv6:222-225.
- Tonino PAL, De Bruyne B, Pijls NHJ, Siebert U, Ikeno F, et al. (2009) Fractional flow reserve versus angiography for guiding percutaneous coronary intervention. NEngl J Med 360:213-224.
- Dattilo PB, Prasad A, Honeycutt E, Wang TY, Messenger JC(2012) Contemporary patterns of fractional flow reserve and intravascular ultrasound use among patients undergoing percutaneous coronary intervention in the United States. JAm CollCardiol 60:2337-2339.
- Sen S, Escaned J, Malik IS, Mikhail GW, Foale RA, et al. (2012) Development andvalidation of a new adenosine-independent index of stenosis severity fromcoronary wave-intensity analysis: results of the ADVISE (ADenosine VasodilatorIndependent Stenosis Evaluation) study. J Am CollCardiol 59:1392-1402.
- Yaeger IA (2016) A multi-artery fractional flow reserve (FFR) approach for handlingcoronary stenosis-stenosis interaction in the multi-vessel disease (MVD) arena.Int J Cardiol203:807-815.
- Yaeger IA (2015) Practicability of multi-artery fractional flow reserve (FFR) method in the assessment of some stenotic coronary artery configurations in percutaneous coronary intervention (PCI) procedures. IntervCardiol J2: 3-31.
- Dodge JT, Brown BG, Bolson EL, Dodge HT(1992) Lumen diameter of normal human coronary arteries – influence of age, sex, anatomic variation, and left ventricular hypertrophy or dilation. Circulation86:232-246.
- Oviedo C, Maehara A, Mintz GS, Araki H, Choi SY, et al. (2010) Intravascular ultrasound classification of plaque distribution in left main coronary artery bifurcations – where is the plaque really located?CircCardiovascInterv3:105-112.
- Zhang LR, Xu DS, Liu XC, Wu XS, Ying YN, et al. (2011) Coronary artery lumendiameter and bifurcation angle derived from CT coronary angiographic image inhealthy people (Article in Chinese). ZhonghuaXinXue Guan Bing ZaZhi39:1117-1123.