Keywords
Average waiting time, Low Latency Queue, real-time traffic; tolerable delay limit
Introduction
For a long period of time communication networks have primarily been wired networks [1]. However, the major dis-advantage of wired networks is their inflexible and immo-bile character. Also, wired networks are considered to be expensive because of the high set up costs of infrastructure and maintenance costs. Since wired networks are expensive, wireless networks have been sought to be the most suitable alternative choice. Wireless networks are popular because they have characteristics such as mobility, reachability, simplicity, maintainability, roaming services and new services. A Mobile Ad hoc Network (MANET) is a combination of wireless mobile nodes that dynamically creates the network in the absence of fixed physical infrastructure. They offer quick and easy network deployment in situations where it is not possible otherwise [2]. MANET is a technology which enables users to communicate without any physical infrastructure regardless of their geographical location and that’s why it is sometimes referred to as an infrastructure less network [3]. The increase of cheaper, small and more powerful devices make MANET a fastest growing network. Despite their widespread usage, there are various challenges that are associated with MANETs that affect their usefulness [4] Firstly, the communication channel between the nodes in the network is highly unreliable. Secondly, the topology of a MANET can change due to the mobility of the nodes in the network. Thirdly, there is need to provide quality of service (QoS) requirements due to demanding applications as a result of commercial usage of multimedia transmission and the rapidly growing number of users, in addition to the type of traffic. This convergence of multimedia traffic with traditional data traffic creates yet another challenge because the former requires strict delay whereas the latter is delay-tolerant. Fourthly, Security due to potentially hostile environments, plus limited bandwidth and energy resources can be counted among other challenges. Due to the above mentioned challenges, guar-anteeing Quality of Service (QoS) requirements to different users in MANETs become extremely hard. One of the most popular scheduling algorithms used in MANETs is Low Latency Queue (LLQ) [5]. LLQ was developed by Cisco to bring strict priority queuing (PQ) to class-based weighted fair queuing (CBWFQ). The LLQ algorithm allows delay-sensitive data (such as voice) to be given preferential treatment over other traffic by letting the data to be dequeued and sent first. The LLQ is a combination of Priority Queuing (PQ) and WFQ [6]. The LLQ scheme uses a strict priority queue that is given priority over other queues, which makes it ideal for delay and jitter sensitive applications. At the time of congestion, LLQ cannot transmit more data than its bandwidth permits, hence if more traffic arrives than the strict priority queue can transmit, it is dropped. The main objective of the study is to develop an improved Low Latency Queueing scheme for Mobile Ad Hoc Networks. The rest of the paper is organized as follow; in the next section, we present the related work, in section III we present the system model. In section IV, we present the performance evaluation and finally conclude in section V.
Related work
The traditional packet scheduling algorithm used in most systems is First-In-First-Out (FIFO), which places all packets into a single queue and processes them in the same order in which they are received. FIFO is easy to implement, however FIFO cannot differentiate among the different types of traffic. To overcome the above limitations and to provide fair sharing of resources, many other types of scheduling methods, such as Priority Queuing (PQ), Weighted Round Robin (WRR), Weighted Fair Queuing (WFQ), Custom Queuing (CQ) and Class-Based Weighted Fair Queuing (CB-WFQ) have been proposed [7]. The real time applications are treated prefer-initially in the priority queuing algorithm. However, when the amount of higherpriority traffic is excessive, the PQ suffers a starvation problem. To overcome the challenges above, Cisco Systems introduced a Low Latency Queuing (LLQ) algorithm which combines a single strict priority queue with CBWFQ. LLQ allows delay-sensitive data (such as voice) to be given preferential treatment over other traffic. However, if sensitive audio and video packets are processed in the single priority queue due to resource sharing between many applications, the expected QoS level cannot be guaranteed. A new approach combined WFQ with LLQ scheduling disciplines to ensure QoS for high priority burst video conferencing, voice and data services at the same time [8]. The main drawback of the WFQ with LLQ is that we get reduced delay of high priority class (video conferencing) but at the same time we get highest delay time of voice traffic proposed a new approach by combining WFQ with LLQ scheduling disciplines to ensure QoS for high priority bursty video conferencing, voice and data services at the same time [9]. The main weakness of the WFQ with LLQ is that although there is reduced delay of high priority class (video conferencing), there is highest delay time of voice traffic.
In a recent study Rukmani et al. [10] developed an Enhanced LLQ (ELLQ) scheduling algorithm that categorizes and pri-oritizes the real-time traffic. In this algorithm an additional priority queue is introduced for scheduling the video applications separately along with the dedicated strict-priority queue for voice applications. The lower priority queues are serviced using CBWFQ. Although this approach offers preferential treatment to real-time traffic, at high arrival rates of voice traffic, the video traffic may suffer starvation and complete resource malnourishment.
To overcome the above challenge, we propose to modify the Enhanced LLQ algorithm by delaying voice packets and servicing video packets as long as the voice packets are not delayed beyond the maximum tolerable delay limit. The voice packets are given priority over video packets to avoid jitter that requires a non-variable delay, which is most important for voice applications. The lower priority packets are serviced using the CBWFQ algorithm.
System model
In this paper, we employ queueing theory. Communication systems have been studied as a network of queues over the past years [11,12]. In particular, queuing theory [13] is used to model arrival and service rate of packets. Queuing models are suitable in a variety of environments ranging from common daily life scenarios to complex service and business processes, operations research problems, or computer and communication systems. Queuing theory has been extensively applied to evaluate and improve system behavior [14-17]. An advantage of the queuing model is that one can use various results available in queuing theory to get appropriate approximations. Kendall introduced a standard notation for classifying queuing systems into different types [11]. We will make use of Kendall’s notation where a queue is referred to by an expression of the form A/B/ X/Y/Z where A and B stand for the distributions of the inter arrival times and service demands respectively, X stands for the number of servers in the system, Y stands for restrictions on system capacity, and Z denotes the scheduling policy that governs the queue.
Video and Voice traffic will be modeled using the MMPP/G/1 queue system. Markov Modulated Poisson Process (MMPP ) is one of the most used models [18-20] to capture the typical characteristics of the incoming traffic such as selfsimilar behavior (correlated traffic), burstiness behavior, and long range dependency, and is simply a Poisson process whose mean value changes according to the evolution of a Markov Chain [21]. Since real time traffic like voice and video signals can be bursty [10,22], Markov Modulated Poisson Process is best fitted to model its arrival rate. MMPP is normally used for modeling bursty traffic owing to its ability to model the timevarying arrival rate and capture the important correlation between inter-arrival times while still maintaining analytical tractability. G stands for general service time distribution, meaning the service time can take on any distribution, e.g exponential or Bounded Pareto, and one server.
In the improved LLQ algorithm, all incoming traffic will arrive at the classifier, from outside the system according to either an MMPP or a Poisson process with specified rate. At the classifier, the traffic will be identified and forwarded to the class of their priority. The required service priority are provided through MAC service class parameters [10]. Real time voice and video packets are forwarded to the strict priority queue, while the other types of data are forwarded to the CBWFQ queue. During service, voice packets are prioritized over video. LLQ provides priority for voice packets to ensure that voice packets are not stuck behind the large video packets. At high arrival rate of voice packets, voice packets are delayed to serve video packets as long as the voice packets are not delayed beyond the tolerable delay limits. In this case the video packets are serviced immediately after the voice packets found in the queue without necessarily waiting to service voice packets that arrive while the video packets are already in the queue. The voice packets are given priority over video to avoid jitter that requires a non-variable delay, which is most important for voice applications. On the other hand the CBWFQ queue will consist of FTP, HTTP and e-mail packets. Figure 1 represents the proposed model.
Figure 1: Improved Low Latency Queuing scheduling algorithm.
In the next section, we derive the expressions for average waiting time for an MMPP/G/1 queue system. We ap-proximate the behavior of an MMPP/G/1 queue analytically. The method employed consists in approximating the MMPP/G/1 queue system using a weighted superposition of different M/G/1 queues.
Expressions for the perform ance metrics
Consider an M M P P/G/1 queue, and let the M MPP that models the incoming data traffic be composed by H states (S1, S2). We use an MMPP with two transition states. Weuse the notation Mi/G/1 to refer to an M/G/1 queue whose average arrival rate is λi observed in state Si, i= 1, 2 and the service rate is μ and is constant among all the Si states.
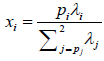
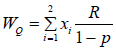
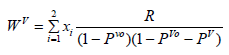
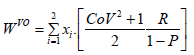
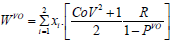
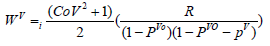
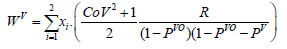
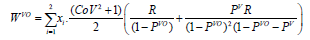
The analytical approximations is based on the observation that if the MMPP stays in state Si long enough without transiting to another state, the average waiting time at time reach the same steady state observed for the corresponding Mi/G/1 queue. The values are pinned on the same steady state value of Mi/G/1 as long as the MMPP does not change its state from Si. Similar approximations have been used to approximate mean queue length and average response time for an MMPP/M/1 queue system [23]. The average packet waiting time is an average evaluated over the number of incoming requests which are not distributed equally over time (during the state S1 the arrival rate of requests is λ1, while during the state S2 the arrival rate of requests is λ2. Therefore, the average packet waiting time of the MMPP/G/1 is a weighted sum of the average packet queuing delays of the M i/G/1 queues, expressed as equation.
The weights (xi) are scaled to keep into account the different arrival rate per each state. Hence
 (1)
(1)
A. Expression for average waiting time of voice packets under MMPP/M/1 queue system before delay
In this section, we derive models for the average waiting time in the queue for voice packets. Assuming a tagged voice packet arriving to the voice queue. This packet will be delayed by:
• Mean residual time of the packets found in service,
• The mean waiting time of the voice packets found in the queue.
The average total waiting time of the tagged voice packet can be derived as follows: We approximate the MMPP/M/1 queue system using a weighted superposition of different M/M/1 queues. Let λ and μ be the rate of arrival for the Poisson process and μ the rate of service for the exponential distribution. Consider the state transition diagram for a simple M/M/1 queue shown in Figure 2.
Figure 2: The state transition diagram for an M/M/1 queue. Adopted [12].
Considering the global balance equations for this system we can derive the general expression for the probability of a packet being in any state:
 (2)
(2)
 (3)
(3)
 (4)
(4)
In general, the probability of a packet being in any state can be deduced as:
 (5)
(5)
Using the fact that
 , We Obtain We obtain Pn = (1-p),
n= 0, 1, 2,...., ∞ (6)
Average number of packets in the queue is given by
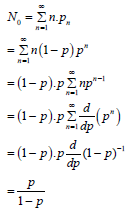
Using little’s law [12], NQ = μWQ, where WQ is the average waiting time in the equation
 (7)
(7)
Since ρ μ is equivalent to the residual service time R. The expression for the average packet waiting time for the two states of MMPP/M/1 can be obtained by combining equations 1 and 7 to obtain:
 (8)
(8)
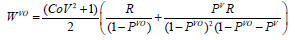
Hence, the expression for the average packet waiting time experienced by the tagged voice packet is given as:
 (9)
(9)
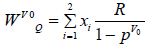
B. Expression for average waiting time of video packets under MMPP/M/1 queue system before delay
In this section, we derive models for the average waiting time in the queue for video packets before delay. Assuming a tagged video packet arriving to the video queue. This packet will be delayed by:
• Mean residual time of the packets found in service,
• The mean waiting time of the high priority voice packets found in the queue,
• The mean waiting time of video packets found in the queue,
• The mean waiting time of subsequent arrivals of voice packets while the tagged video packet is waiting in the queue for service.
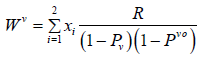
The expression for the average waiting time for video packets can be derived as shown below:
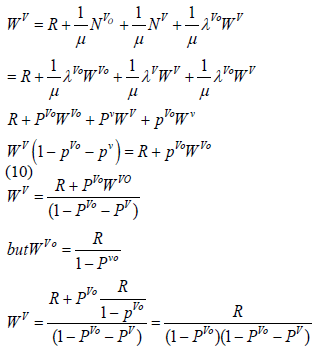 (10)
(10)
The expression for the average waiting time for packets in the video queue is given by
 (11)
(11)
Expression for average waiting time of voice packets in an MMPP/M/1 queue after being delayed once in this section, we derive models for the average waiting time in the queue for voice packets after being delayed once. Assuming a tagged voice packet arriving to the voice queue. This packet will be delayed by:
• Mean residual time of the packets found in service,
• The mean waiting time of the voice packets found in the queue,
• The mean waiting time of video packets found in the queue, the expression for the average waiting time for the tagged voice packet can be derived as shown below:
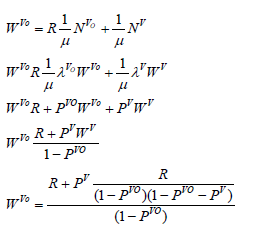 (12)
(12)
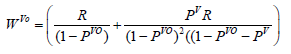
Therefore, the expression for the average waiting time for packets in the voice queue after being delayed once is given by
 (13)
(13)
Expression for average waiting time for video packets in an MMPP/M/1 queue after delaying voice packets once in this section, we derive models for the average waiting time in the queue for video packets after delaying voice packets once. Assuming a tagged video packet arriving to the video queue. This packet will be delayed by:
• Mean residual time of the packets found in service,
• The mean waiting time of the voice packets found in the queue,
• The mean waiting time of video packets found in the queue, the expression for the average waiting time for the tagged voice packet can be derived as shown below:
 (14)
(14)
Therefore, the expression for the average waiting time for packets in the video queue after delaying voice packets once is given by
 (15)
(15)
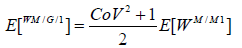
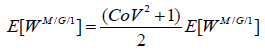
Expression for average waiting time of voice packets under MMPP/BP/1 queue system before delay in this section, we derive models for the average waiting time in the queue for voice packets under MMPP/BP/1 queue system. The expression for average packet waiting time in the queue for MMPP/BP/1 can be derived from the general expression for MMPP/G/1. However, the average waiting time of a packet for MMPP/G/1 queue system can be got by approximating the MMPP/G/1 queue system using a weighted superposition of different M/G/1 queues. There are various approximations for the average waiting time experienced by requests under the M/G/1 queue system [23-25]. A naturally refined heavytraffic approximation exploiting the exact M/M/1 results is given in [28] as
 (16)
(16)
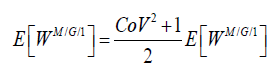
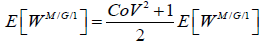
Where CoV is the coefficient of variation of the service time distribution. The coefficient of variation defined as the ratio of the standard deviation to the mean of a distribution is a common metric to measure the variability of a distribution, and the higher the CoV value of a distribution, the higher the variability of the distribution. E [WM/G/1] is the average waiting time under M/G/1 queue system, and E[WM/M/1] is the average waiting time under M/M/1 queue system. The expression for the average waiting time of packets under MMPP/G/1 can be deduced as follows: From equation 7, the average waiting time of a voice packet under M/G/m can be deduced as:
 (17)
(17)
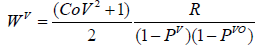
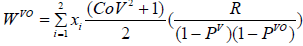
The expression for the average waiting time for a tagged voice packet before delay for two states for MMPP/G/1 is given as:
 (18)
(18)
In the next section, we derive the expression for average waiting time of video packet under the MMPP/G/1 queue system before delaying the voice packet.
Expression for average waiting time of video packets under MMPP/BP/1 queue system before delaying the voice packet in this section, we derive models for the average waiting time in the queue for video packets under MMPP/BP/1 queue system. Using a similar approach as used in section IV-E, the average waiting time of video packets can be estimated using the M/M/1 results given in [28] as:
 (19)
(19)
The expression for the average waiting time of video packets before delaying the voice packets under MMPP/G/1 can be deduced from equation 10 as follows:
 (20)
(20)
Therefore, the expression for the average waiting time for a tagged video packet before delaying the voice packets for two states for MMPP/G/1 is given as
 (21)
(21)
In the next section, we derive the expression for average waiting time of voice packet under the MMPP/G/1 queue system after delaying the voice packets. Expression for average waiting time of voice packets in an MMPP/BP/1 queue after being delayed once in this section, we derive models for the average waiting time in the queue for voice packets after being delayed once under MMPP/ BP/1 queue system. Using a similar approach as used in section IV-E, the average waiting time of voice packets can be estimated using the M/M/1 results given in [28] as
 (22)
(22)
The expression for the average waiting time of voice packets after delaying the voice packets once under MMPP/G/1can be deduced from equation 12 as follows
 (23)
(23)
Therefore, the expression for the average waiting time of voice packets after delaying the voice packets once for two states for MMP P/G/1 is given as:
 (24)
(24)
In the next section, we derive the expression for average waiting time of video packets under the MMP P/G/1 queue system after delaying the voice packets. H. Expression for average waiting time of video packets in an MMP P/BP/1 queue after delaying voice packets once in this section, we derive models for the average waiting time in the queue for video packets after delaying voice packets once under MMPP/BP/1 queue system. Using a similar approach as used in section IV-E, the average waiting time of voice packets can be estimated using the M/M/1 results given in [26] as
 (25)
(25)
The expression for the average waiting time of video packets after delaying the voice packets once under MMP P/G/1 can be deduced from equation 14 as follows:
 (26)
(26)
Therefore, the expression for the average waiting time of video packets after delaying the voice packets once for two states for MMP P/G/1 is given as:
 (27)
(27)
In this section, we test the performance of the derived models. We evaluate the performance of voice and video packets under the MMPP/M/1 and MMPP/BP/1 queue systems before and after delaying voice packets once using MATLAB and present numerical results. Furthermore, we also compare the performance of voice and video packets under MMPP/M/1 and MMPP/BP/1 queue systems. We specifically use MMPP/M/1 and MMPP/BP/1 which are special cases of MMPP/G/1 in terms of average waiting time. The results nicely illustrate the impact of delayed voice packets on the performance of both voice and video packets. We also investigate the impact of correlated arrivals as compared to Poisson arrivals.
Table 1 show the basic mathematical notations used in the study
| Notation |
Meaning |
| λv |
Average arrival rate of video packets in the system. |
| λvo |
Average arrival rate of voice packets in the system. |
| pv |
Load in the system due to video packets. |
| PVO |
Load in the system due to voice packets. |
| PVµ |
Service rate of packets in the system. |
Table 1: Basic mathematical notations used.
We consider the MMPP parameters that are set on the basis of the results reported [27], which has shown, via real traces analysis, the feasibility to model incoming traffic to a GRID server. According to the data reported [28], the incoming data traffic of the analyzed GRID server can be modeled by a 2-state MMPP model, whose parameters are presented in Table 2. The transition probability p1 from state S1 to state S2 is 0.17, while the transition probability p2, from state S2 to state S1, is 0.08. For voice packets, we use the recommended maximum delay of 150ms as per the ITU-T recommendation G.114 [30]. Usually the loss of some amount of voice packets is compensated using redundant data to recover lost content and silence intervals. For video packets, we consider interactive video and video on demand applications which also have maximum tolerable delay limit of 150 ms [29]. Arrival rates of packets in the system is set from 0 packets/ second to 22.1 packets/second, arrival rates of packets within similar ranges have been used to analyze performance of MANETS [30,31]. In addition Basarkod et al. [32] used arrival rate of 0 to 24 packets per second to simulate an on-demand Quality of Service (QoS) and stability based multicast routing (OQSMR) scheme in MANETS. Table 2 shows the hypothetical parameters used in the analysis which is consistent with parameters used in literature [29,33,34,35].
| Parameter |
Value |
| Service time, μ 10 ms |
10ms |
| Maximum delay limit for voice packets, |
150ms [30] |
| Maximum delay limit for video packets, |
150ms [30] |
| Load, |
0 to 0.9 |
| Transition states |
Two |
| Arrival rate |
5 to 10 packets/second |
| p1 |
0.17 |
| p2 |
0.08 |
| λ1 |
22.10 requests/second |
| λ2 |
7.16 requests/ second |
| Squared coefficient of variation for BP distribution[28] |
CoV2 = 0.53 |
Table 2: Implementation parameters.
A. Evaluation of average waiting time for voice packets under MMPP/M/1 before and after delay In this section, we investigate the performance of voice packets before and after delay. In doing this, we determine the changes in average waiting time with increase in load and arrival rate. Average waiting time for voice packets as a function of load under MMPP/M/1 system we compare the performance of voice packets before and after delay under MMPP/M/1 queue system in terms of average waiting time as a function of load due to voice and video packets. The results nicely illustrate the impact of delaying voice packets to serve video packets in terms of average waiting time as the performance metric.
Figure 3 shows a graph of average waiting time of voice packets as a function of load due to voice packets. We used equations 9 and 13 to plot the graph. It can be observed from Figure 3 that average waiting time increases with increase in load due to voice packets regardless of whether the voice packets are delayed or not. The increase in average waiting time as the load due to voice packets increase can be explained by the fact that as the load increases, the number of voice packets to be processed in the system also increases. We further observe that for low load values, the average waiting time for voice packets under MMPP/M/1 queue system before and after delay are much closer, however as the load due to voice packets increase the average waiting time after delay are much higher than before delay. The difference in average.
Figure 3: Average waiting time of voice packets under MMPP/M/1 as a function of load due to voice
packets.
Waiting time before delay and after delay is more pronounced for higher load values. We also observe that voice packets can be delayed to serve video packets as long as the load due to voice packets in the system does not exceed 81% as shown by the maximum tolerable delay.
Figure 4 shows a graph of average waiting time of voice packets as a function of load due to video packets. We used equations 9 and 13 to plot the graph. We observe from Figure 4 that average waiting time of voice packets increase with increase in load due to video packets irrespective of whether the voice packets are delayed or not. The increase in average waiting time of voice packets as the load due to video packets increase can be explained by the fact that as the load due to video packets increase, the number of video packets to be processed in the system also increases and this in turn increases the residual service time that affects the average waiting time of voice packets. We further observe that for low load values, the average waiting time for voice packets under MMPP/M/1 queue system before and after delay are much closer, however as the load due to video packets increase the average waiting time after delay is much higher than before delay. The difference in average waiting time before delay and after delay is more pronounced for higher load values. We also observe that voice packets can be delayed to serve video packets without restrictions on the load due to video packets in the system. Average waiting time for voice packets as a function of arrival rate under MMPP/M/1 system we compare the performance of voice packets before and after delay under MMPP/M/1 queue system in terms of average waiting time as a function of arrival rate of voice and video packets.
Figure 4: Average waiting time of voice packets under MMPP/M/1 as a function of load due to video packets.
Figure 5 shows a graph of average waiting time of voice packets as a function of arrival rate of voice packets. We used equations 9 and 13 to plot the graph. We observe from figure 5 and that average waiting time of voice packets increase with increase in arrival rate of voice packets before and after delaying voice packets. Increase in arrival rate leads to increase in the number of packets to be processed in the system which in turn leads to increase in average waiting time. We also observe that at low arrival rate of voice packets, the average waiting time for voice packets under MMPP/M/1 queue system.
Figure 5: Average waiting time of voice packets under MMPP/M/1 as a function of arrival rate of
voice packets.
Before and after delay are much closer; however as the arrival rate of voice packets increase the average waiting time after delay is much higher than before delay. The difference in average waiting time before delay and after delay is more pronounced at higher arrival rates of voice packets. We also observe that voice packets can be delayed to serve video packets as long as the arrival rate of voice packets in the system does not exceed approximately 14 packets/second as shown by the maximum tolerable delay limit.
Figure 6 shows a graph of average waiting time of voice packets as a function of arrival rate of video packets. We used equations 9 and 13 to plot the graph. We observe from figure 6 that average waiting time of voice packets increase with increase in arrival rate of video packets before and after delaying voice packets. Increase in arrival rate of video packets leads to increase in the number of packets to be processed in the system which in turn leads to increase in average waiting time. We also observe that at low arrival rate of video packets, the average waiting time for voice packets under MMPP/M/1 queue system before and after delay are much closer, however as the arrival rate of video packets increase the average waiting time after delay is much higher than before delay. The difference in average waiting time before delay and after delay is more pronounced at higher arrival rates of video packets. We further observe that voice packets can be delayed to serve video packets as long as the arrival rate of video packets in the system does not exceed approximately 16 packets/second.
Figure 6: Average waiting time of voice packets under MMPP/M/1 as a function of arrival rate of
video packets.
B. Evaluation of average waiting time for video packets under MMPP/M/1 before and after delay In this section, we investigate the performance of video packets before and after delay. In doing this, we determine the changes in average waiting time with increase in load and arrival rate. Average waiting time for video packets as a function of load under MMPP/M/1 system we compare the performance of video packets before and after delay under MMPP/M/1 queue system in terms of average waiting time as a function of load due to voice and video packets. The results nicely illustrate the impact of delaying voice packets to serve video packets in terms of average waiting time as the performance metric.
Figure 7 shows a graph of average waiting time of video packets as a function of load due to voice packets. We used equations 11 and 15 to plot the graph. We observe from figure 7 that average waiting time of video packets increase with increase in load due to voice packets regardless of whether the voice packets are delayed or not. The increase in average waiting time of video packets as the load due to voice packets increase can be explained by the fact that as the load due to voice packets increase, the number of voice packets to be processed in the system also increases and this in turn increases the average waiting time of video packets since video packets have to wait for voice packets found in the system to be serviced before they receive service. We further observe that for low load values, the average waiting time of video packets under MMPP/M/1 queue system before and after delay are much closer, however as the load due to voice packets increase the average waiting time after delay is much lower than before delay. The difference in average waiting time before delay and after delay is more pronounced for higher load values of voice packets. We also observe that video packets experience lower average waiting time as a result of delaying voice packets to serve video packets, and the reduction in average waiting time is much higher at higher load values of voice packets.
Figure 7: Average waiting time of video packets under MMPP/M/1 as a function of load due voice
packets.
Figure 8 shows a graph of average waiting time of video packets as a function of load due to video packets. We used equations 11 and 15 to plot the graph. We observe from figure 8 that average waiting time of video packets increase with increase in load due to video packets regardless of whether.
Figure 8: Average waiting time of video packets under MMPP/M/1 as a function of load due to
video packets.
The voice packets are delayed or not. The increase in average waiting time of video packets as the load due to video packets increase can be explained by the fact that as the load due to video packets increase, the number of video packets to be processed in the system also increases and this in turn increases the average waiting time of video packets. We further observe that for low load values, the average waiting time of video packets under MMPP/M/1 queue system before and after delay are much closer, however as the load due to video packets increase the average waiting time after delay are much lower than before delay. The difference in average waiting time before delay and after delay is more pronounced for higher load values of video packets. We also observe that video packets experience lower average waiting time as a result of delaying voice packets to serve video packets, and the reduction in average waiting time is higher at higher load values of video packets. Average waiting time for video packets as a function of arrival rate under MMPP/M/1 system We compare the performance of video packets before and after delay under MMPP/M/1 queue system in terms of average waiting time as a function of arrival rate of voice and video packets.
Figure 9 shows a graph of average waiting time of video packets as a function of arrival rate of voice packets. We used equations 11 and 15 to plot the graph. We observe from figure 9 that average waiting time of video packets increase with increase in arrival rate of voice packets irrespective of whether the voice packets are delayed or not. The increase in average waiting time of video packets as the arrival rate of voice packets increase can be explained by the fact that as the arrival rate of voice packets increase, the number of voice packets to be processed in the system also increases and this in turn increases the average waiting time of video packets since video packets have to wait for voice packets found in the system to be serviced before they receive service. We further observe that for low arrival rates, the average waiting time of video packets under MMPP/M/1 queue system before and after delay are much closer, however as the arrival rate of voice packets increase the average waiting time after delay are lower than before delay. The difference in average waiting time before delay and after delay is more pronounced for higher arrival rates of voice packets. We also observe that video packets experience lower average waiting time as a result of delaying voice packets to serve video packets, and the reduction in average waiting time is much higher at higher arrival rates of voice packets. We further observe that video packets can be delayed to serve video packets as long as the arrival rate of voice packets in the system does not exceed approximately 14 packets/second.
Figure 9: Average waiting time of video packets under MMPP/M/1 as a function of arrival rate of
voice packets.
Figure 10 shows a graph of average waiting time of video packets as a function of arrival rate of video packets. We used equations 11 and 15 to plot the graph. We observe from figure 10 that average waiting time of video packets increase with increase in arrival rate of video packets regardless of whether the voice packets are delayed or not. The increase in average waiting time of video packets as the arrival rate of video packets increase can be explained by the fact that as the arrival rate of video packets increase, the number of video packets to be processed in the system also increases which results into increase in the average waiting time of video packets. We further observe that for low arrival rates of video packets, the average waiting time of video packets under MMPP/M/1 queue system before and after delay are closer, however as the arrival rate of video packets increase the average waiting time after delay is lower than before delay. The difference in average waiting time before delay and after delay is more pronounced for higher arrival rates of video packets. We further observe that video packets can be delayed to serve video packets as long as the arrival rate of video packets in the system does not exceed approximately 21 packets/second.
Figure 10: Average waiting time of video packets under MMPP/M/1 as a function of arrival rate of
video packets.
Evaluation of average
Waiting time for voice packets
Under mmpp/bp/1 before and
After delay
In this section, we compare the performance of voice packets before and after delay under MMPP/BP/1 queue system in terms of average waiting time as a function of load and arrival rate. The results nicely illustrate the impact of delaying voice packets to serve video packets in terms of average waiting time as the performance metric. Average waiting time for voice packets as a function of load under MMPP/BP/1 system we compare the performance of voice packets before and after delay under MMPP/BP/1 queue system in terms of average waiting time as a function of load due to voice and video packets.
Figure 11 shows a graph of average waiting time of voice packets as a function of load due to voice packets under MMPP/BP/1 queue system. We used equations 18 and 24 to plot the graph. We observe from figure 11 that average waiting time of voice packets increase with increase in load due to voice packets regardless of whether the voice packets are delayed or not. The increase in average waiting time of voice packets as the load due to voice packets increase can be explained by the fact that as the load due to voice packets increase, the number of voice packets to be processed in the system also increases and this in turn increases the average waiting time of voice packets. We further observe that for low load values, the average waiting time of voice packets under MMPP/BP/1 queue system before and after delay are much closer, however as the load due to voice packets increase the average waiting time after delay is much higher than before delay. The difference in average waiting time before delay and after delay is more pronounced for higher load values of voice packets. We also observe that voice packets can be delayed to serve video packets as long as the load due to voice packets does not exceed 81% as shown by the maximum tolerable delay limit.
Figure 11: Average waiting time of voice packets under MMPP/BP/1 as a function of load due to
voice packets.
Figure 12 shows a graph of average waiting time of voice packets as a function of load due to video packets under MMPP/BP/1 queue system. We used equations 18 and 24.
Figure 12: Average waiting time of voice packets under MMPP/BP/1 as a function of load due to
video packets.
To plot the graph. We observe from figure 12 that average waiting time of voice packets increase with increase in load due to video packets regardless of whether the voice packets are delayed or not. The increase in average waiting time of voice packets as the load due to video packets increase can be explained by the fact that as the load due to video packets increase, the number of video packets to be processed in the system also increases and this in turn increases the average waiting time of voice packets since voice packets are affected by the residual service time of video packets in service. We further observe that for low load values of video packets, the average waiting time of voice packets under MMPP/BP/1 queue system before and after delay are much closer, however as the load due to video packets increase the average waiting time after delay is much higher than before delay. The difference in average waiting time before delay and after delay is more pronounced for higher load values of video packets. We also observe that voice packets can be delayed to serve video packets even when the load due to video packets reaches approximately 85%. Average waiting time for voice packets as a function of arrival rate under MMPP/BP/1 system We compare the performance of voice packets before and after delay under MMPP/BP/1 queue system in terms of average waiting time as a function of arrival rate of voice and video packets.
Figure 13 shows a graph of average waiting time of voice packets as a function of arrival rate of voice packets under MMPP/BP/1 queue system. We used equations 18 and 24 to plot the graph. We observe from figure 13 that average waiting time of voice packets increase with increase in arrival rate of voice packets regardless of whether the voice packets are delayed or not. The increase in average waiting time of voice packets as the arrival rate of voice packets increase can be explained by the fact that as the arrival rate of voice packets increase, the number of voice packets to be processed in the system also increases and this leads to increase in the average waiting time of voice packets. We further observe that for low arrival rate values of voice packets, the average waiting time of voice packets under MMPP/BP/1 queue system before and after delay are closer, however as the arrival rate of voice packets increase the average waiting time after delay is higher than before delay. The difference in average waiting time before delay and after delay is much higher at higher arrival rate of voice packets. We also observe that voice packets can be delayed to serve video packets as long as the arrival rate of voice packets does not exceed 14 packets/second.
Figure 13: Average waiting time of voice packets under MMPP/BP/1 as a function of arrival rate of
voice packets.
Figure 14 shows a graph of average waiting time of voice packets as a function of arrival rate of video packets under MMPP/BP/1 queue system. We used equations 18 and 24 to plot the graph. We observe from figure 14 that average waiting time of voice packets increase with increase in arrival rate of video packets irrespective of whether the voice packets are delayed or not. We further observe that for low arrival rate values of video packets, the average waiting time of voice packets under MMPP/BP/1 queue system before and after delay are closer, however as the arrival rate of video packets increase the average waiting time after delay is higher than before delay. The difference in average waiting time before delay and after delay is higher at higher arrival rates of video packets. We also observe that voice packets can be delayed to serve video packets as long as the arrival rate of video packets does not exceed approximately 15 packets/second. A. Evaluation of average waiting time for video packets under MMPP/BP/1 before and after delaying voice packets In this section, we compare the performance of video packets before and after delaying voice packets under MMPP/ BP/1 queue system in terms of average waiting time.
Figure 14: Average waiting time of voice packets under MMPP/BP/1 as a function of arrival rate
of video packets.
Average waiting time for video packets as a function of load under MMPP/BP/1 system we compare the performance of video packets before and after delaying under MMPP/BP/1 queue system in terms of average waiting time as a function of load due to voice and video packets.
Figure 15 shows a graph of average waiting time of video packets as a function of load due to voice packets under MMPP/BP/1 queue system. We used equations 21 and 27 to plot the graph. We observe from figure 15 that average waiting time of voice packets increase with increase in load due to voice packets irrespective of whether the voice packets are delayed or not. We further observe that for low load values of video packets, the average waiting time of voice packets under MMPP/ BP/1 queue system before and after delay are closer, however as the load due to voice packets increase the average waiting time after delay is lower than before delay. The difference in average waiting time before delay and after delay is higher at higher arrival rates of voice packets. We also observe that voice packets can be delayed to serve video packets even when the load due to voice packets is approximately 90%.
Figure 15: Average waiting time of video packets under MMPP/BP/1 as a function of load due to
voice packets.
Figure 16 shows a graph of average waiting time of video packets as a function of load due to video packets under MMPP/BP/1 queue system. We used equations 21 and 27 to plot the graph. We observe from figure 16 that average waiting time of video packets increase with increase in load due to video packets regardless of whether the voice packets are delayed or not. The increase in average waiting time of video packets as the load due to video packets increase can be explained by the fact that as the load due to video packets increase, the number of video packets to be processed in the system also increases and this in turn increases the average waiting time of video packets. We further observe that for low load values of video packets, the average waiting time of video packets under MMPP/BP/1 queue system before and after delay are much closer, however as the load due to video packets increase the average waiting time after delay is lower than before delay. The difference in average waiting time before delay and after delay increases as the load due to video packets increase. We also observe that voice packets can be delayed to serve video packets without restrictions on the load due to video packets.
Figure 16: Average waiting time of video packets under MMPP/BP/1 as a function of load due to
video packets.
Average waiting time for video packets as a function of arrival rate under MMPP/BP/1 system we compare the performance of video packets before and after delaying under MMPP/BP/1 queue system in terms of average waiting time as a function of arrival rate of voice and video packets.
Figure 17 shows a graph of average waiting time of video packets as a function of arrival rate of voice packets under MMPP/BP/1 queue system. We used equations 18 and 24 to plot the graph. We observe from figure 16 that average waiting time of video packets increase with increase in arrival rate of voice packets regardless of whether the voice packets are delayed or not. The increase in average waiting time of video packets as the arrival rate of voice packets increase can be explained by the fact that as the arrival rate of voice packets increase, the number of voice packets to be processed in the system also increases and this leads to increase in the average waiting time of video packets since video packets have to wait for voice packets found in the system to be serviced before video packets can get serviced. We further observe that for low arrival rate values of voice packets, the average waiting time of video packets under MMPP/ BP/1 queue system before and after delay are closer, however as the arrival rate of voice packets increase the average waiting time after delay are lower than before delay. The difference in average waiting time before delay and after delay is much higher at higher arrival rate of voice packets. We also observe that voice packets can be delayed to serve video packets for arrival rates of voice packets of up to approximately 22 packets/second.
Figure 17: Average waiting time of video packets under MMPP/BP/1 as a function of arrival rate of
voice packets.
Figure 18 shows a graph of average waiting time of video packets as a function of arrival rate of video packets under MMPP/BP/1 queue system. We used equations 18 and 24 to plot the graph. We observe from figure 18 that average waiting time of video packets increase with increase in arrival rate of video packets irrespective of whether the voice packets are delayed or not. The increase in average waiting time of video packets as the arrival rate of video packets increase can be explained by the fact that as the arrival rate of video packets increase, the number of video packets to be processed in the system also increases and this leads to increase in the average waiting time of video packets. We further observe that for low arrival rate values of video packets, the average waiting time of video packets under MMPP/BP/1 queue system before and after delay are closer, however as the arrival rate of video packets increase the average waiting time after delay is lower than before delay. The difference in average waiting time before delay and after delay is much higher at higher arrival rate of video packets. We also observe that voice packets can be delayed to serve video packets for arrival rates of video packets of up to approximately 22 packets/second. Next, we evaluate the trade off in improvement in performance of video packets against degradation in service of voice packets under MMPP/M/1. B. Trade-off in improvement in performance of video packets and degradation in service of voice packets under MMPP/M/1 In this section, we investigate the trade off in improvement in performance of video packets against the degradation in performance of voice packets in terms of average waiting time as a function of load and arrival rate under MMPP/M/1 queue system.
Figure 18: Average waiting time of video packets under MMPP/BP/1 as a function of arrival rate of
video packets.
Figure 19 shows a graph of average waiting time of voice and video packets as a function of load due to voice packets under MMPP/M/1 queue system. We used equations 9 and 13, 11 and 15 to plot the graph. We observe from figure 19 that average waiting time of both voice and video packets increase with increase in load due to voice packets irrespective of whether the voice packets are delayed or not. We further observe that video packets experience a higher improvement. in performance as a result of reduced average waiting time, for example, at the load of 0.4 the average waiting time is reduced by 0.0028 seconds while the increase in average waiting time of voice packets at the same load is increased by 0.001 seconds. A similar trend is observed at a load of o.6 where the reduction in average waiting time of video packets is 0.014 while the increase in average waiting time of voice packets is 0.005 seconds. We also observe that voice packets can be delayed to serve video packets as long as the load due to voice packets does not exceed 81%
Figure 19: Average waiting time of voice and video packets under MMPP/M/1 as a function of load
due to voice packets.
Figure 20 shows a graph of average waiting time of voice and video packets as a function of arrival rate of voice packets under MMPP/M/1 queue system. We used equations 9 and 13, 11 and 15 to plot the graph. We observe from figure 20 that average waiting time of both voice and video packets increase with increase in arrival rate of voice packets regardless of whether the voice packets are delayed or not. We further observe that video packets experience a higher improvement in performance as a result of reduced average waiting time, for example, at the arrival rate of 5 packets/ second the average waiting time is reduced by 0.005 seconds while the increase in average waiting time of voice packets at the same arrival rate is increased by 0.004 seconds. A similar trend is observed at a arrival rate of 10 packets/second where the reduction in average waiting time of video packets is 0.03 while the increase in average waiting time of voice packets is 0.02 seconds. We also observe that voice packets can be delayed to serve video packets as long as the arrival rate of voice packets does not exceed 14 packets/second. C. Trade off in improvement in performance of video packets and degradation in service of voice packets under MMPP/BP/1 In this section, we investigate the trade off in improvement in performance of video packets against the degradation in performance of voice packets in terms of average waiting time as a function of load and arrival rate under the MMPP/ BP/1 queue system.
Figure 20: Average waiting time of voice and video packets under MMPP/M/1 as a function of
arrival rate of voice packets.
Figure 21 shows a graph of average waiting time of voice and video packets as a function of load due to voice packets under MMPP/BP/1 queue system. We used equations 18 and 18, 21 and 21 to plot the graph. We observe from figure 21 that average waiting time of both voice and video packets increase with increase in load due to voice packets regardless of whether the voice packets are delayed or not. We further observe that video packets experience a higher improvement in performance as a result of reduced average waiting time, for example, at the load 0.4 the average waiting time is reduced by 0.0025 seconds while the increase in average waiting time of voice packets at the same arrival rate is increased by 0.0008 seconds. A similar trend is observed at a load of 0.6 where the reduction in average waiting time of video packets is 0.014 while the increase in average waiting time of voice packets is 0.004 seconds. We also observe that voice packets can be delayed to serve video packets as long as the load does not exceed 81%.
Figure 21: Average waiting time of voice and video packets under MMPP/BP/1 as a function of load
due to voice packets.
Video packets as a function of arrival rate of voice packets under MMPP/BP/1 queue system. We used equations 18 and 18, 21 and 21 to plot the graph.
We observe from Figure 22 that average waiting time of both voice and video packets increase with increase in arrival rate of voice packets regardless of whether the voice packets are delayed or not. We further observe that video packets experience a higher improvement in performance as a result of reduced average waiting time, for example, at arrival rate of 5packets/second the average waiting time is reduced by 0.003 seconds while the increase in average waiting time of voice packets at the same arrival rate is 0.004 seconds. A similar trend is observed at arrival rate of 10 packets/ second where the reduction in average waiting time of video packets is 0.02 while the increase in average waiting time of voice packets is 0.017 seconds. We also observe that voice packets can be delayed to serve video packets as long as the arrival rate does not exceed 15 packets/second.
Figure 22: Average waiting time of voice and video packets under MMPP/BP/1 as a function of
arrival rate of voice packets.
Conclusion
In a recent study, an Enhanced LLQ (ELLQ) scheduling algorithm that categorizes and prioritizes the real-time traffic was developed. In this algorithm an additional priority queue is introduced for scheduling the video applications separately along with the dedicated strict-priority queue for voice applications while the lower priority queues are serviced using CBWFQ. However, at high arrival rate of voice traffic, the video traffic may suffer resource starvation. To overcome this drawback, we propose an improved LLQ algorithm which delays voice packets that arrive while the video packets are already in the queue and services video packets as long as the voice packets are not delayed beyond the maximum tolerable delay limits. We modeled the LLQ scheduling scheme using the MMPP/G/1 queue system. Two special cases of MMPP/G/1 are used, that is, MMPP/M/1 and MMPP/BP/1 which exhibit correlated arrivals and exponential and Bounded Pareto service times respectively. The numerical results obtained from the derived models show that average waiting time of both voice and video packets increase with increase in load and arrival rates of packets in the system. We also observe that delaying voice packets leads to reduction in the average waiting time of video packets and an increase in the average waiting time of voice packets, however the reduction in average waiting time of video packets is higher than the increase in the average waiting time of voice packets. Furthermore, we observe that voice packets can be delayed to serve video packets as long as the load and arrival rates of voice packets does not exceed 81% and 14 packets/second respectively.
Acknowledgment
The authors would like to thank Makerere University for the financial support.
References
- Sarkar SK, Basavaraju TG, Puttamadappa C (2007) Ad Hoc Mobile Wireless Networks: Principles, Protocols, and Applications. Auerbach publications.
- Roland H, (2009) Queueing Models for Mobile Ad Hoc Networks. Res Info
- P Jumnani, M Zaveri (2014) A Novel Cross-Layer Architecture for Video Streaming Over MANET.
- Veeralakshmi M, Pugazendi (2013) Depiction of Routing Protocols in Mobile Adhoc Networks: Behaviour Analysis. Int J Comp Sci Mob Comp 2: 96-101.
- Bora k (2013) Efficient Use of Resources in Mobile Ad Hoc Networks.
- Wallance K (2010) Authorized Self-Study Guide-Cisco Voice over IP (CVOICE).
- Semeria C (2001) Supporting Differentiated Service Classes: Queue Schedul-ing Disciplines Jun Net Inc.
- Tetsuji H (2010) Analysis of Multiclass Feedback Queues and its Application to a Packet Scheduling Problem. 541-568.
- Dekeris B, Adomkus T, Budnikas A (2006) Analysis of QoS Assurance Using Weighted Fair Queueing (WFQ) Scheduling Discipline with Low Latency Queue (LLQ). Sci Res
- Rukmani P, Ganesen R, (2016) Enhanced Low Latency Queueing Algorithm for real Time Applications in Wireless Networks. Int J Tech 7: 663-672.
- Glenbe E, Pujolle G, Nelson JCC (1987), Introduction to Queuing Networks. John Wiley & Sons, Inc
- Kleinrock L (1976) Queueing Systems. John Wiley & Sons Inc
- Stallings W (2000) Queuing Analysis WilliamStallings.com/StudentSupport.htmal.
- Gupta MBV, Balter H, (2010) Analysis of Scheduling Policies under Correlated Job Sizes. Per Eval 67: 996-1013.
- Adan JBF, Kulkarni VG (2003) Single-server queue with Markov-dependent inter-arrival and service times. Nat Res 45: 113-134.
- Civelek, Biller B, Scheller Wolf A (2009) The Impact of Dependence on Queueing Systems.
- Seshasayee UR, Rathinam M, (2012), Correlated M/G/1 Queue mod-elling of Jitter Buffer in TDMoIP.
- Yoshihara T, Kasahara S, Takahashi Y (2001) Practical Time-Scale Fitting of Self-similar traffic with Markov Modulated Poisson process. Telecommunication Systems 17: 185-211.
- Nogueira P, Salvador R, Valadas, Pacheco A, (2004) Fitting self-similar traffic by a superposition of MMPPs modeling the distribution at multiple time scales. 87: 678-688.
- Rodriguez P, Spanner C, Biersack EW (2001) Analysis of Web Caching Architectures: Hierarchical and Distributed Caching. 9: 404-418.
- Fischer W, Meier Hellstern K (1993) The Markov-modulated Poisson process (MMPP) cookbook 18: 149-171.
- Iftikhara M, Ahmadb I (2014), A Novel Analytical Model for Provision-ing QoS in Body Area Sensor Networks. 900-907.
- Ciciani B, Santoro A, Romano P (2007) Approximate Analytical Models for Networked Servers Subject to MMPP Arrival Processes.
- Gans N, Koole G, Mandelbaum A (2003) Telephone Call Centers: Tutorial, Review and Research Prospects. 5: 79-141.
- Hokstad (1978) Approximations for the M/G/m Queue. Operations Research.
- Yao DD (1985) Refining the Diffusion Approximation for the M/G/m Queue. Operational Research 33: 1266-1277.
- Boxma OJ, Cohen JW, Huffels N (1979) Approximations of the Mean Waiting Time in an M/G/s Queueing System. Oper Res
- Allen O (1990) Probability Statistics and Queuing Theory, with computer Science Applications.
- Li H, Muskulus M, Wolters L (2006) Modeling Job Arrivals in adata-intensive Grid.”
- ITU-T Recommendation G.114 (2003) International telephone connections and circuits-General Recommendations on the transmission quality for an entire international telephone connection.
- Rohal P, Dahiya R, Dahiya P (2013) Study and Analysis of Through-put Delay and Packet Delivery Ratio in MANET for Topology Based Routing Protocols (AODV, DSR and DSDV). Int J Adv Res Eng Tech. 1: 54-58.
- Basarkod PI, Manvi SS, (2014) On-demand QoS and Stability Based Multicast Routing in Mobile Ad Hoc Networks. J Tel Info Tech
- Kumar R, Misra M, Sarje AK (2010) A Simplified Analytical Model for End-To-End Delay Analysis in MANET. Int J Comp Appl 4: 195-199.
- Chhabra A, Singh G (2011), Performance Evaluation and Delay Mod-elling of VoIP Traffic over 802.11 Wireless Mesh Network. Int J Comp Appl 21: 7-13.
- Carvalho L, Mota E, Aguiar R, Barreto A (2005) An E-Model Im-plementation for Speech Quality Evaluation in VoIP Systems,” IEEE Symp Comp Com.