Keywords
Silver nanoparticles; Fate; Dissolution; Adsorption, Aggregation; River water; Seawater
Introduction
Nanomaterials are increasingly used in many different industrial fields such as microelectronics, micro-machineries, optics and composite materials [1]. In the particular case of silver derived nanoproducts, nanoparticles (AgNP) can be found in cosmetics, plastics, clothing, toothbrushes, food storage products and in coatings on medical instruments [2-5]. Silver is mostly used for its antibacterial properties which have been known since ancient time [6,7]. Several publications revealed that silver is toxic for some aquatic organisms in both ionic and nano particulate forms as well as harmful for natural bacterial communities [8-13]. It is now recognized that AgNP are released from clothes during normal use and washing [2,14-16] and can be found in the aquatic environment, although the analysis of nanoparticles dispersed in environmental samples is still a major analytical challenge [17-19].
The environmental chemistry of AgNP attracted the attention of a large number of researchers in recent years [20-24]. These studies and some others led to a generally accepted model involving a dissolution mechanism of AgNP in natural waters where surface metallic silver is first oxidized by dissolved molecular oxygen to form Ag2O coating layers on AgNP surface, followed by a rapid dissolution of Ag2O to get free Ag+ in solution [25-27]. Actually, Ag+ can be trapped by chloride (Cl-) and stabilized as chlorocomplexes in fresh and saline waters [24,25]. It was concluded by a number of authors that AgNP are not stable in natural waters and should vanish by the combined effects of aggregation and dissolution. However, coating agents such as citrate, as well as polymers like polyvinylpyrrolidone (PVP), polyallylamine (PAAm) and some polysaccharides are known to enhance the stability (reduce solubility and aggregation) of nanoparticles in water [28,29]. Properties of AgNP can also be changed along with their shape and their coating agent dependent on chemical composition of waters. Recently, studies reported complex interactions between organic coated AgNP and natural organic matter (NOM) with the influence of pH and particle size [30,31].
Although recent studies highlighted chronic effects of AgNP on stream microbial communities and uptake of AgNP in saltmarsh plants and associated microbial communities little is yet known about the chemical behaviour of AgNP in freshwater and marine ecosystems, and some discrepancies in the literature need to be addressed [32,33]. Properties of estuarine waters such as alkalinity, ionic strength, as well as composition and concentration of natural organic matter vary greatly in the mixing process between fresh and salt waters and could strongly influence AgNP chemistry. Because of the high ionic strength of saline waters, early work suggested that nanoparticles dispersed in marine waters would rapidly aggregate and be found in the sediment biofilms [34]. A fast dissolution in seawater by formation of soluble silver chloro-complexes (AgCln n-1) was alternatively proposed in such a way that AgNP might not contaminate the marine sediment because they would not be persistent in environmental compartments containing dissolved oxygen [22,25]. However, other researchers observed only a partial dissolution of AgNP, even after 125 days, AgNP were still present in the suspension in pure water [21]. It was concluded by these authors that aggregation process in presence of natural organic matter slowed down dissolution of nanoparticles by a reduction of the chemically active surface of nanoparticles. Also the size of AgNP is considered as very important as dissolution of very small AgNP (5 nm) in natural river and lake waters was observed over a 4 month exposure period, but only very slow dissolution for large organic coated AgNP (50 nm) appeared under similar conditions [35]. There is clearly a need to compare aggregation and dissolution processes of uncoated and organic coated-AgNP in freshwater and saltwater under strictly identical experimental conditions to minimize confounding factors.
In an attempt to contribute to our understanding of the fate of AgNP in natural waters, our attention was focused on the auto-aggregation and dissolution of two very different and well characterized AgNP (bare and poly(allyl)amine coated) and two highly contrasted natural waters: pristine river water (RW) exempt of anthropogenic contamination and natural coastal waters (hereafter called seawater: SW) collected along the St. Lawrence Estuary (Canada). To simplify experimental design and minimize possible confounding effects from some natural factors, natural waters were filtered through 0.20 μm membrane to remove suspended particulate matter (which included microbial community) because our prime interest was to observe autoaggregation process over time and effects of dissolved organic matter. In addition, to mimic the fate of AgNP in hypoxic waters ( O2 content below 25% saturation) in bottom layers of some lakes and deep estuarine waters, the effects of high and low dissolved O2 concentrations were determined. Constant low temperature (7°C) to minimize bacterial activity, if any and absence of light were maintained during experiments.
Materials and Methods
Materials
Silver nitrate powder (AgNO3, >99%), maltose powder (90-95%) and polyallylamine (PAAm) (as a viscous liquid with molecular weight ~65,000 Da) were purchased from Sigma Aldrich. Sodium hydroxide pellets came from Anachemia. Ammonium hydroxide (29.2%), nitric acid and hydrogen peroxide solutions were trace metal grade and purchased from Sigma Aldrich. The deionized water (DW: 18 MΩ⋅cm resistivity) was provided by a deionized water system Nanopure Infinity™ from Barnstead. All labware and glassware were cleaned using 10% nitric acid and rinsed twice with deionized water before use.
Synthesis of silver nanoparticles
Bare AgNP and PAAm AgNP were synthesized following published methods to obtain nanoparticles with a diameter around 20 to 40 nm [29,36]. In the case of bare AgNP, 2 mL of 0.01 mol⋅L-1 silver nitrate (AgNO3) were poured in a 50 mL beaker with 10 mL of 5.84 mM ammonium hydroxide, then 250 μL of 0.1 M sodium hydroxide and 8 mL of 25 mM. D-maltose was added. The solution quickly turned yellow-brown and was stirred at ambient temperature for 15 min. The suspension was dialysed with 10 kDa molecular weight cut off regenerated cellulose membranes from Thermo Scientific® against deionized water over a 24 h period. The dialyzed water was changed 4 times to maximize the removal of free silver ions and maltose residues [29]. Bare AgNP was stored in the dark at 7°C for a maximum of one day before use. Immediately after dialysis, a sub-sample was analysed for total silver. Another one was ultracentrifuged (150,000g) for 20 min and the supernatant was analysed for free silver ions. The cut-off of the centrifugation was estimated to 5-6 nm, which means very small AgNPs could have contributed to the dissolved phase. The bare AgNP stock suspension had a total concentration of 4.06 mM with 0.26% free silver ions (0.09 μM).
For PAAm AgNP synthesis, a volume of 190 mL of deionized water (DW) was poured in a 500 mL two-neck round-bottom flask with glass beads. A volume of 5 mL of 200 mg⋅mL-1 silver nitrate and 5 ml of 280 μLmL-1 PAAm were added to the flask. The solution was brought to slow ebullition for 60 min. After cooling the suspension was ultrafiltered through Ultracel® 30 KDa (ultrafiltration Disc regenerated cellulose from Millipore®) and washed several times to remove unreacted silver ions and PAAm in excess. The retentate was recovered in DW and the resulting PAAm-AgNP suspension was stored in dark at 7°C for a maximum of 24 h before use. After ultrafiltration, a sample was analysed for total silver and a sub-sample was ultrafiltered and filtrate analysed for free silver ion concentration. PAAm-AgNP stock suspension had a total silver concentration of 2.8 mM with 2.6% free silver ions (0.9 μM). This method could underestimate the amount of free silver ions as some Ag+ could be trapped on filter membrane [37]. Ultracentrifugation was not used in this clean-up process because dissolved PAAm prevented settling of PAAm-AgNP in centrifuge tube.
Experimental setting
The dissolution and aggregation of different AgNP were observed over a period of 13 days in different waters and with different concentrations of dissolved oxygen. Modified 125 mL amber plastic bottles (HDPE, Nalgene®) were used for the experiment with two syringe needles, one located on the shoulder of the bottle and reaching near the bottom for bubbling air or nitrogen and the other one through the screw cap of the bottle for adding reactants or removing samples. Sampling, injection and bubbling were performed via top or side needles in a way that water in bottles had not been in contact with the atmosphere during the experiment period to avoid possible contamination from outside.
The bottles were filled with 119 mL of river water (RW) or seawater (SW). Then, a first set of bottles was bubbled with dust-free air from a pressurized cylinder to obtain a saturated concentration of dissolved oxygen, for 15 min before the experiment and for 5 min after each sampling to maintain oxygen saturation level during the experiment. In a similarly way, nitrogen gas (analytical grade 99.95%) was bubbled instead of air in another set of bottles to reduce the O2 level in water samples to mimic a hypoxic situation (below 25% O2 saturation). Dissolved O2 concentration was measured with an oxygen probe YSI 550A from YSI Inc. Bottles were kept in the dark at 7°C to avoid photooxidation and reduce possible bacterial development. A total of 8 conditions were studied: 2 different natural waters × 2 different AgNP × 2 different oxygen contents. Each condition was tested in duplicate.
At the starting point of the experiment, 1.0 mL of AgNP (bare or PAAm AgNP) suspension was injected in the bottles. Concentrations of nanoparticles in bottles were of 34 μM (3.625 mgL-1) for bare-AgNP and 24 μM (2.550 mgL-1) for PAAm AgNP. The sampling started a few seconds after the injection of AgNP suspension (day 0) and was repeated after days 1, 2, 3, 4, 6, 8, 10 and 13. Before each sampling, each bottle was vigorously shaken to homogenize the suspension, and a volume of 5.0 mL was immediately sampled using a 5 mL syringe. One mL was transferred to a glass cuvette to determine the size distribution of nanoparticles using DLS technique and the rest was ultracentrifuged at 150,000g for 20 min for bare AgNP. For PAAm AgNP, ultracentrifugation was not efficient enough and ultrafiltration was performed using a 10 KDa copolymer styrene/ butadiene membrane with a centrifugal filter device (Amicon Ultra 4, Millipore), samples were centrifuged at 7,150g for 15 min with a Centrifuge 5430 R from Eppendorf. After the separation was completed, 2 mL of filtered water were sampled; 1 mL was added to 2 mL nitric acid in cryovials in duplicate and stored at 7°C for further digestion and ICP-MS analysis. The same protocol was used for both types of AgNP. Again, ultrafiltration may have underestimated the amount of dissolved silver ions in filtrate [37].
Adsorption of silver on bottle inner wall
It has been previously reported that ionic silver can quantitatively adsorb on glass and plastic surfaces in the course of field and experimental work [38-40]. The simple measurement of adsorbed silver on bottle inner wall at the end of the experiment described above would not provide an appropriate result as the adsorption is not considered as a linear process with time and it would be impossible to distinguish adsorbed silver ions from adsorbed AgNP. Not considering adsorption on bottle inner wall would have led to apparent precipitation instead of dissolution curves for AgNP which is not expected. To circumvent this problem and estimate the contribution of silver adsorption on HDPE bottle inner wall to dissolution curves, a parallel experiment was conducted using same HDPE bottles and water types as described in the previous section. Bottles were carefully cleaned in nitric acid and rinsed with DW to assure no silver was present on their inner surface before experiment. Each bottle was filled with 119 mL of one of the two water types and one mL of a silver nitrate solution in DW was added to reach a silver final concentration of 1.0 μM, a value corresponding to the mid-range of silver concentrations found in solution after dispersion of both bare- and PAAm AgNPs. Bottles were capped, shaken and stored in the dark at 7°C. At the following sampling times: 1 h, 6 h, 12 h, 24 h, 2 days, 4 days, 8 days and 12 days, one bottle for each water type was sampled for silver analysis. Also one bottle was used as a method blank without addition of silver for each sampling time. The samplings started by shaking vigorously the bottle, and then empty it from its content. After 30 min letting the bottle upside down to drain completely, 10 mL of concentrate nitric acid were added, and the bottle shaken twice within 5 min. Nitric acid was entirely poured out in a 15 mL Flacon® tube for further ICP-MS analysis. This method provided the adsorption kinetic of silver ions on bottle inner wall assuming the fate of Ag+ in experimental bottles was the same as observed in this parallel experiment because experimental conditions were strictly the same in both assays.
Characterization of water samples
The conductivity and pH were measured with a conductivity probe, EC215 Conductivity Meter Hanna instrument, and a pH probe, pH 213 Microprocessor pH meter Hanna instrument, respectively. River water (RW) was sampled from the Neigette River (QC), a small river mainly draining a forested area without anthropogenic inputs. One large sample of seawater (SW) was collected from the biological station of ISMER/UQAR, located along the St Lawrence Estuary near Rimouski (Canada). All water samples were filtered through 0.2 μm nylon sterile filters (Fisher Scientific) before use in experiments to avoid any contribution of particulate matter from natural waters and minimize any interference from bacterial development. Major ions were analysed by ICP-MS and dissolved organic carbon (DOC) was determined by high temperature catalytic oxidation (Shimadzu TOC-5050, Pt catalyst).
Diameter and size distribution of nanoparticles
The hydrodynamic diameter and the distribution size of the bare- and PAAm coated AgNP were determined by dynamic light scattering (DLS) using a Zetasizer Nano ZS (Malvern instrument UK). The measurement temperature was 7°C and the scattering angle was 173°. To determine a mean size distribution, six measurements of six successive runs of 15 s were performed for each water sample and two replicates for each sampling time were analyzed. Disposable cuvettes, pre-washed with 10% hydrochloric acid and rinsed with deionized water and ethanol (100%) were used. Zetasizer® measurements provided the mean hydrodynamic diameter from volume based calculation. An important increase of the hydrodynamic diameter was assumed to be due to aggregation of AgNP. Preliminary work with DLS showed that intensity-based size provided erratic results with polydisperse AgNP suspensions by exaggerating the proportion for large particles and obscuring the distribution of smaller ones (results not shown). The volume-based size determination was preferred to the intensity-based size (Z-average) also because the polydispersity index (PDI) was always below 0.3 on a scale of 0 to 1 (Malvern software). In monodisperse samples, the volumebased distribution could give a mean value smaller than the real value (Malvern instruction manual), whereas some unexpected very small particles could appear in polydisperse suspensions. These artefacts are addressed in the interpretation of AgNP distribution. Transmission electron microscopy (TEM, LVEM5 Delong Instrument®) was used to observe the size and shape of AgNP. One drop of AgNP suspension diluted in dry ethanol (100%) was placed on a holey carbon film coated on 400 mesh copper grid from Ted Pella Inc. Nanoparticles were mostly spherical and highly opaque to light transmission indicating a similar high metal density for both bare- and PAAm AgNP. The mean distribution size of nanoparticle suspensions was determined just before injection into experimental bottles.
Aggregation of bare AgNP
For a closer examination of the effects of DOC and ionic strength on AgNP aggregation kinetics for both water types, the previously described experimental setting was repeated with bare AgNP, keeping all conditions unchanged, including bubbling of air or nitrogen. Only the sampling design was different with sampling times at 15 min, 1 h, 6 h, 12 h, 2 days, 4 days, 8 days and 12 days. The experiment was not repeated with PAAm AgNP because size determination by DLS method did not provide accurate enough measurements (high variability attributed to polymer coating around nanoparticles) to observe minute changes in particle distribution with time.
Silver analysis
The total silver content and total dissolved silver concentration of AgNP stock suspensions were determined by inductively coupled plasma mass spectrometry (Agilent ICP-MS 7500C equipped with ChemStation v.3.04). Before ICP-MS analysis, 2.0 mL of concentrated nitric acid and 0.5 mL hydrogen peroxide were added to samples and, without sealing the cap, samples were put under the fume hood for 45 min. Digestion was completed in a water bath (65°C) for 45 min. After digestion, 1 mL of digested sample was mixed with 5 mL of deionised water, stored at 7°C and analysed within 2 days. Using isotope 107Ag, each measurement was a mean of five repetitions with an acquisition time of 1.9 sec. The calibration was done from silver standard in 2% HNO3 (1.000 mgL-1) purchased from Certiprep®. The calibration curve had 9 points from 0.75 to 200 μgL-1. The detection limit was 0.015 μgL-1 1 (0.14 nM) and the quantification limit was 0.120 μgL-1 (0.0011 μM).
Statistics
All errors are expressed as standard deviation (SD). Dissolution slopes, regression coefficients and significance (p) were determined using free access software PAST (version 3.09) from University of Oslo (https://folk.uio.no/ohammer/past/). Differences in conditions influencing dissolution were tested with repeated measures ANOVA with 3 factors: AgNP types, water types and dissolved oxygen concentrations. Normality of the residues and variance were not reached. After transformation for normality, results were similar to untransformed data, so the database was not modified. All statistical analyses were computed using JMP Pro 11™ software.
Results
Characteristics of water samples and synthesized AgNP
Main characteristics of water samples used in this experiment are given in Table 1. Concentrations of all major ions and conductivity of seawater (salinity: 28.5 psu) were much higher than RW, but DOC was lower than RW. Silver was naturally present at very low concentrations in RW and SW. Ionic strength in RW was about 200 times lower than SW, but pH was slightly more basic in RW. Chloride ions concentration in RW was very low (0.13 mM or 4.6 mg L-1) compared to seawater (437.2 mM or 15.5 g L-1) (Table 1).
| Components |
RW |
SW |
| Calcium (mM) |
1.0 |
11.4 |
| Magnesium (mM) |
0.35 |
48.6 |
| Sodium (mM) |
0.41 |
396.1 |
| Potassium (mM) |
0.01 |
8.0 |
| Chloride (mM) |
0.13 |
437.2 |
| Silver (nM) |
5.0 |
2.4 |
| DOC (µM) |
308 |
217 |
| pH |
8.02 |
7.61 |
| Conductivity (µS/cm) |
255 |
44,000 |
| Ionic strength (M) |
0.0030 |
0.5418 |
Table 1: Major ions (mM), natural silver (nM) concentrations, dissolved organic carbon (DOC), pH, conductivity and calculated ionic strength of river water (RW) and seawater (SW).
Main characteristics of bare and PAAm coated-AgNP and concentrations added in bottles are summarized in Table 2. The mean size of bare-AgNP was slightly higher when determined by DLS compared to TEM direct observation indicating little or no effect of any organic coating and confirmed the bare nature of these AgNP. In contrast, the mean size of PAAm-AgNP determined by DLS was more than 17 times larger than observed by TEM. The presence of high molecular weight PAAm coating AgNP could explain high values in light scattering measurement although PAAm coating was not visible by TEM, which provided a realistic average diameter of 19 nm. UV-Vis measurement provided λmax=420 nm for bare AgNP in DW. Because the size could be a determining factor in dissolution rate of AgNP in natural waters, concentrations of bare- and PAAm AgNP were adjusted to provide a similar surface of silver (Ag0) exposed to water types although the number of AgNP was about 3 times higher in PAAm AgNP [23,41]. Using the mean diameter of nanoparticles as determined by TEM, the number of nanoparticles was estimated for each type of particles assuming a spherical shape and the absence of aggregation before the beginning of the experiment. Total surface of each type of AgNP was calculated from their estimated number and their TEM diameter. Concentration of free silver ions in experimental bottles was 0.09 and 0.6 μM for bare and PAAm AgNP, respectively, due to the difficulty to remove completely ionic silver from PAAm AgNP stock solution (Table 2).
| Parameters |
Bare-AgNP |
PAAm-AgNP |
| Mean diameter by DLS (nm) determined in deionized water before experiment |
41 ± 2 (n=6) |
337 ± 9 (n=6) |
| Mean diameter by TEM (nm) determined in dry ethanol before experiment |
33 ± 5 (n=43) |
19 ± 5 (n=87) |
| UV-visible analysis (lmax, nm) |
420 |
n.d. |
| AgNP concentration in bottle (µM) |
34 |
24 |
| Free silver ions concentration (µM) % of free silver at t=0 in bottle |
0.09 0.26% |
0.6 2.6% |
| Total number of AgNP in bottle (× 1010) |
2.14 |
7.63 |
| Total surface of AgNP in bottle (mm2) |
73.1 |
85.6 |
Table 2 Main characteristics of bare and PAAm AgNP in stock solutions and concentrations added in bottles. Number of measurements (n) is given in brackets.
pH, dissolved oxygen and initial AgNP concentration
The pH was monitored in experimental bottles for one hour following the addition of various nanoparticles species. Results indicated that adding nanoparticles in water did not influence the pH, variations being not significantly different between nanoparticle types for the same water composition (results not shown).
Concentrations of dissolved O2 were determined for different water samples after bubbling with air or nitrogen. River water with a low ionic strength showed saturation level in oxygen at 13.0 ± 0.6 mgL-1 whereas SW reached a lower value around 10.8 ± 0.4 mgL-1. As expected, nitrogen bubbling did not remove all dissolved oxygen and residual O2 was 2.8 ± 1.2 mgL-1 for RW and 1.8 ± 0.6 mgL-1 for SW. Taking saturation levels as 100% for each water sample, it is observed thatN2 bubbling reduced O2 content at 21.5% for RW and 16.4% for SW. These O2 levels corresponded to hypoxic conditions often encountered in deep water layers of some lakes, fjords and estuaries.
Adsorption kinetics of silver on bottle inner wall
Slow adsorption of dissolved silver on bottle inner wall was observed for RW and was almost absent in SW (<3%) due to high ionic strength. Most importantly, these results show that more than 70% of an initial amount of 1.0 μM Ag+ added to RW was adsorbed on inner wall leaving only 30% as “free Ag+” in solution after 8 days with a plateau until day 12. Adsorption of silver added to SW was negligible and not correction was applied. Assuming in first instance that the adsorption kinetic was only depending on initial free Ag+ concentration in water (other chemical species being in large excess and not controlling the adsorption reaction), it becomes possible to apply a correction factor to dissolution curve to take in account adsorption on bottle inner wall which was occurring simultaneously with the dissolution process of AgNP, but was impossible to determine during the course of the experiment. To do so, the adsorption percentage for RW found in Figure 1 (using the best fit equation) for each sampling period was applied to the corresponding initial Ag+ concentration (measured after 15 min) and the result added to the analytical value. As an example, the inner wall adsorption after 2 days in RW was 27%. This percentage was applied to the initial concentration of free Ag of bare AgNP in RW with high O2 (0.51 μM in top left panel in Figure 2) and the result (0,138 μM) was added to the mean value already obtained by chemical analysis of day 2 sample (0.26 μM) to give a total of 0.40 μM. Relatively slow but important adsorption of silver ions on bottle inner wall in RW is attributed to a co-adsorption of DOC+Ag+ on HDPE surface at pH ≈ 8 [39]. Although this empirical method can be subject to critics mainly because calculations are based on initial Ag ions concentration and on-going dissolution of AgNP during the experimental time, it is still the only method found to take in account, at least in part, Ag wall adsorption during AgNP dissolution process. It should be noted that both bare and PAAm AgNP could also be adsorbed on bottle inner walls during the course of the experiment, but this should not have drastically changed the dissolution process because most of the surface of nanoparticles should stay available to oxidative process, if any or release of entrapped silver ions. Total surface of bare or PAAm AgNP in each bottle was much smaller than total surface of inner walls of bottle them (108 cm2) and should not have interfered on adsorption of Ag+ on inner walls (Figure 1 and Table 2).
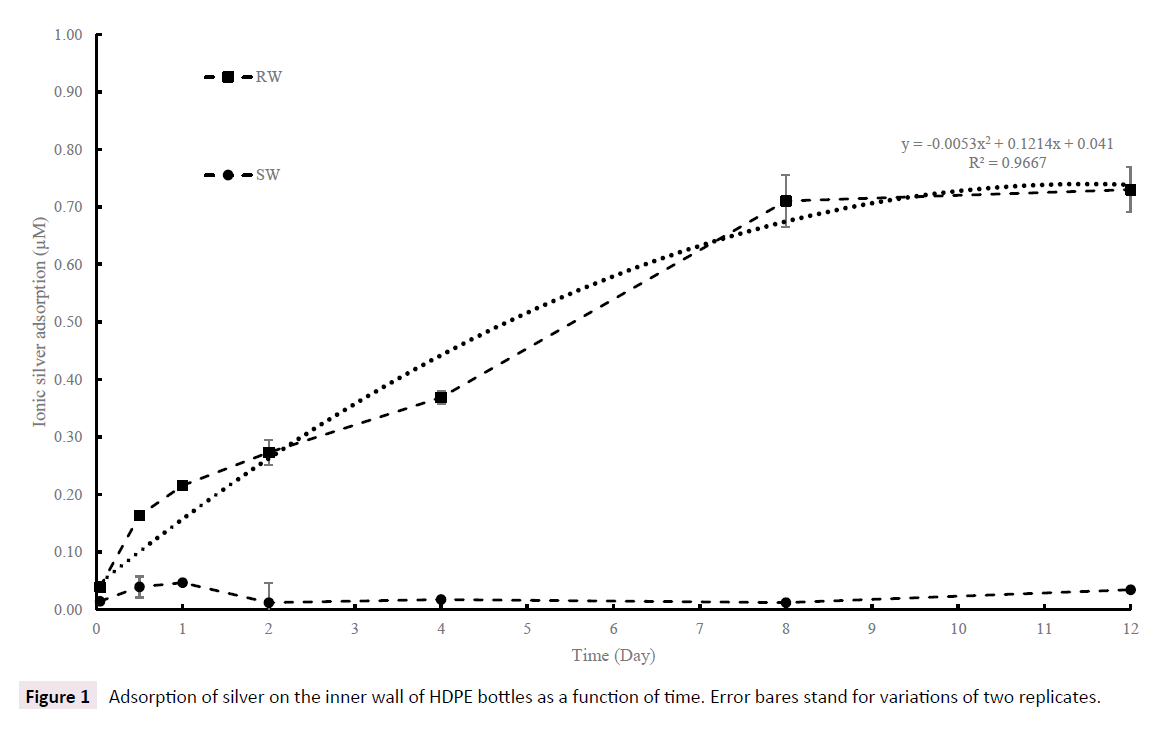
Figure 1: Adsorption of silver on the inner wall of HDPE bottles as a function of time. Error bares stand for variations of two replicates.
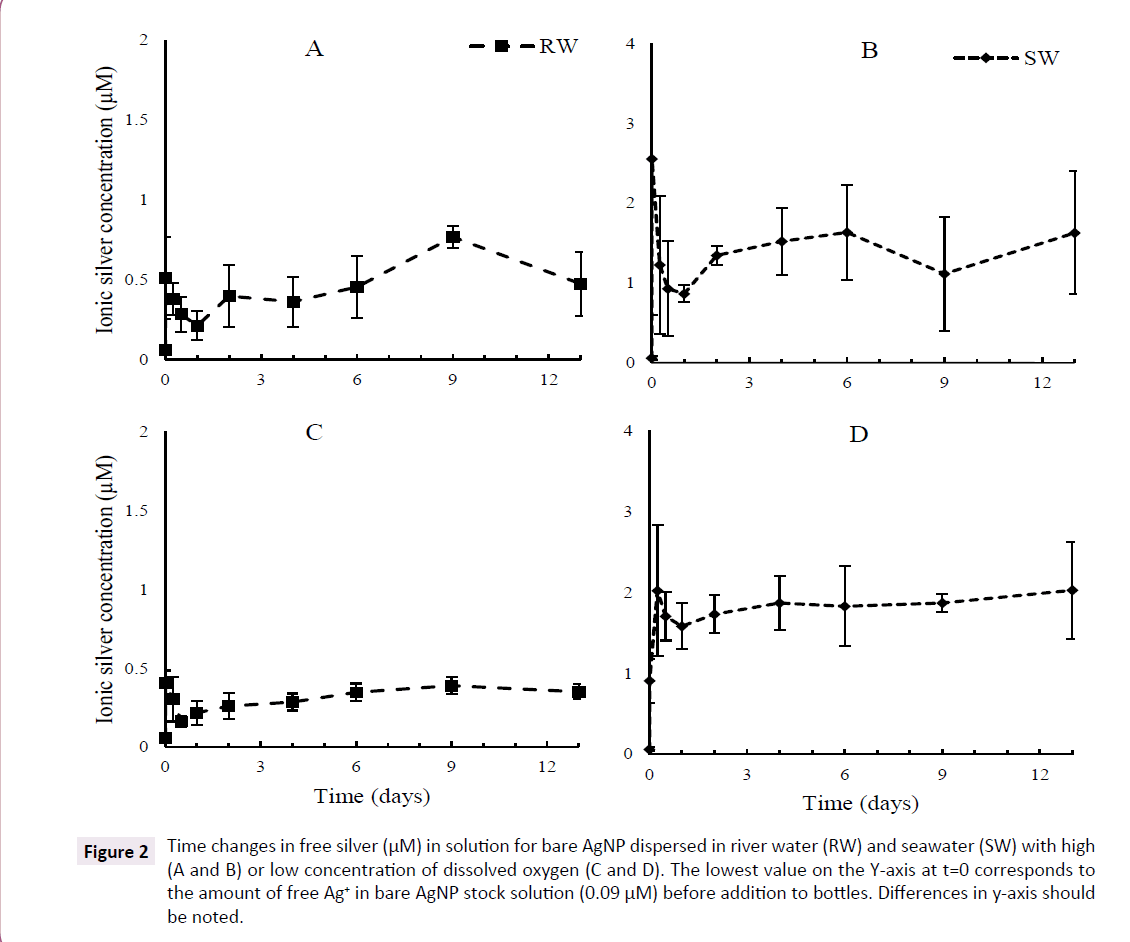
Figure 2: Time changes in free silver (µM) in solution for bare AgNP dispersed in river water (RW) and seawater (SW) with high (A and B) or low concentration of dissolved oxygen (C and D). The lowest value on the Y-axis at t=0 corresponds to the amount of free Ag+ in bare AgNP stock solution (0.09 µM) before addition to bottles. Differences in y-axis should be noted.
Concentration of free + adsorbed Ag ions
The concentration of free + wall adsorbed Ag increased quickly in the first moments of the experiment under all conditions and then evolved slowly following the type of water used. Bare AgNP released 4 to 5 times more Ag in SW than in RW although such a difference is not seen with PAAm AgNP. The concentration of free Ag in SW remained relatively stable for bare AgNP, but increased slowly and steadily for PAAm AgNP until the end. No clear evidence of dissolution is observed for both bare and PAAm AgNP in RW although the amount of free Ag released by PAAm AgNP in RW is much higher than bare AgNP. High and low O2 content had little or no visible effects on the long term pattern of dissolution of both bare and PAAm AgNP in RW, but low O2 slightly increased dissolution of PAAm AgNP in seawater (Figures 2 and 3).
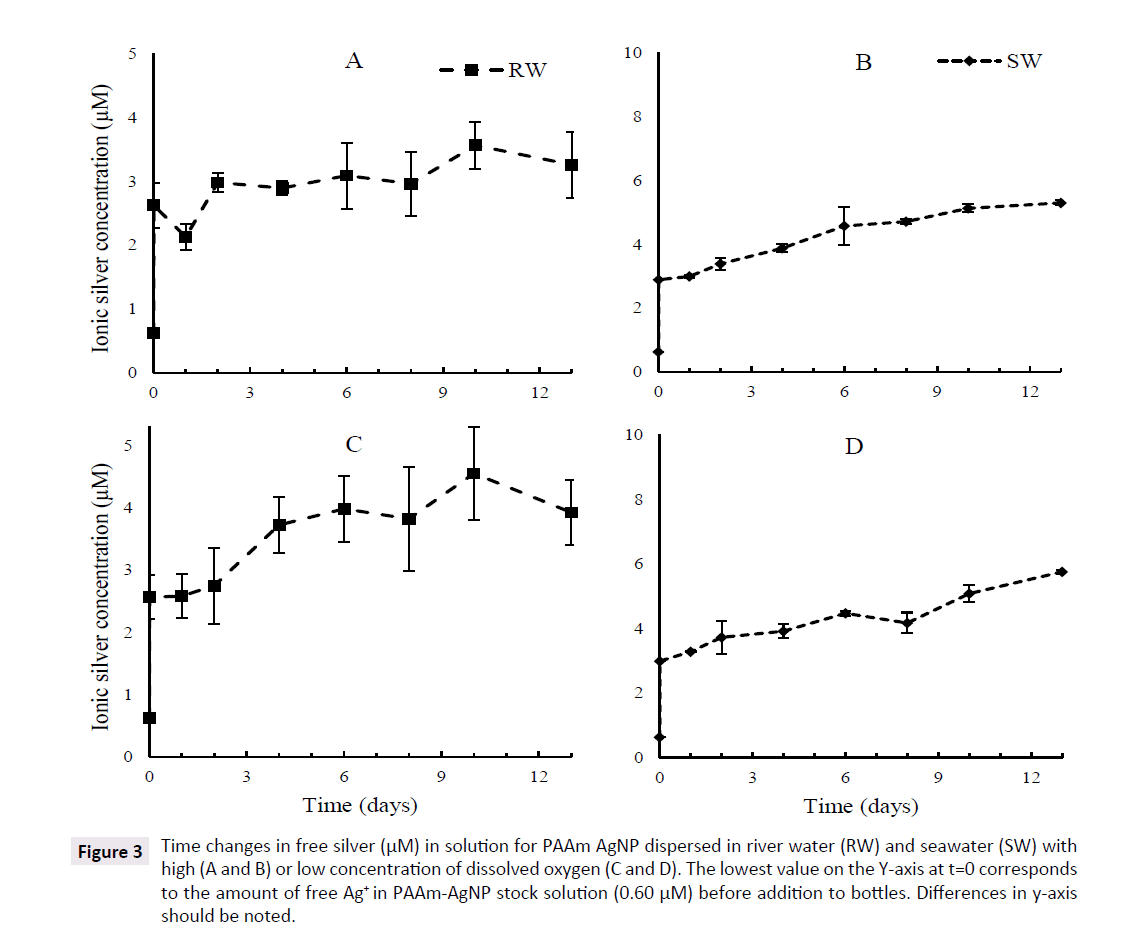
Figure 3: Time changes in free silver (µM) in solution for PAAm AgNP dispersed in river water (RW) and seawater (SW) with high (A and B) or low concentration of dissolved oxygen (C and D). The lowest value on the Y-axis at t=0 corresponds to the amount of free Ag+ in PAAm-AgNP stock solution (0.60 µM) before addition to bottles. Differences in y-axis should be noted.
A closer examination of the behaviour of free silver in the first 48 h of the experiment revealed a complex pattern, particularly with bare AgNP. The first determination of free silver was obtained about 15 min (including sampling time and centrifugation or filtration) after the injection of AgNP suspension in bottles (considered as t=0 in statistical analysis). In all cases with bare AgNP, the maximum value was observed at the first sampling time and then concentrations of free Ag decreased over a period of 12 to 24 h and started to slowly increase or stay almost stable. The pattern was different in the case of PAAm AgNP where the first release reached 2.5 to 3 μM for both water types, which was much higher than bare AgNP. Although the same instant increase of free Ag was present in all experimental bottles, the decrease in the first 24 to 48 h is barely visible or even not present from PAAm AgNP (Figures 2 and 3).
Assuming the first 48 h were mainly governed by fast desorption/ adsorption of Ag species on surface, the dissolution of AgNP in both water types can be illustrated by calculating the slope and regression coefficient of each experimental curve using a simple linear regression between day 2 and the last sampling day. In all cases with RW, these slopes are very low, with small R2 and high p values, indicating the absence or very low long-term dissolution of bare and PAAm AgNP. The only clear exception appeared with PAAm AgNP in seawater where slopes are positive with high R2 values, indicating a slow, but significant, increase of free silver in solution. The dissolution rate for PAAm-AgNP in seawater was between 0.129 and 0.194 μM/day representing between 8.3 and 12.9% of initial PAAm-AgNP concentration over 2 weeks for high and low dissolved O2, respectively. The dissolution appears to be slightly faster in SW with low O2 (Table 3).
Aggregation of bare-AgNP
The protocol for the 12 day experiment was identical to the previous one, but was only dedicated to aggregation process of bare AgNP in RW and SW. Deionized water (DW) was included in results as a reference medium, as DW is completely depleted in DOC and shows a very low ionic strength (<10-6 M). In first instance, the distribution of nanoparticles was measured in all media within 15 min after the addition of bare AgNP. In deionized water, the distribution of bare AgNP was unimodal with a maximum size of 28 nm and an average size of 31.6 nm. The abundance is given in % volume. When bare AgNP was added to RW, a tri-modal distribution appeared with some very small nanoparticles mainly below 10-15 nm. In SW, the distribution was unimodal with an average value of 27.9 nm. Peaks below the average size of bare AgNP in different media are attributed to artefacts in volume-based determination and are discussed below (Figure 4).

Figure 4: Size distribution of bare AgNP after 15 min in deionized water (DW), river water (RW) and seawater (SW). The arrows represent the original mean diameter of distribution of the silver nanoparticles determined by electron microscopy.
As expected, aggregation of bare AgNP in seawater was observed within a few hours with little changes in following days. Figure 5 shows the superimposition of seven particle size distributions in SW obtained between 1 h and 12 days with high and low O2. The average size of particles after 12 h was 590 ± 15 nm for high O2 and 496 ± 5 nm for low O2, indicating larger particles in high O2 bottles. After 12 days, the average size was 529 ± 125 nm for high O2 and 614 ± 56 nm for low O2 which are not significantly different from each other (P>0.01) indicating a slow process leading to similar results with particles ranging between 0.4 and 0.6 μm. Formation of much larger particles may be possible, but could not be detected with DLS technique (Figure 5).
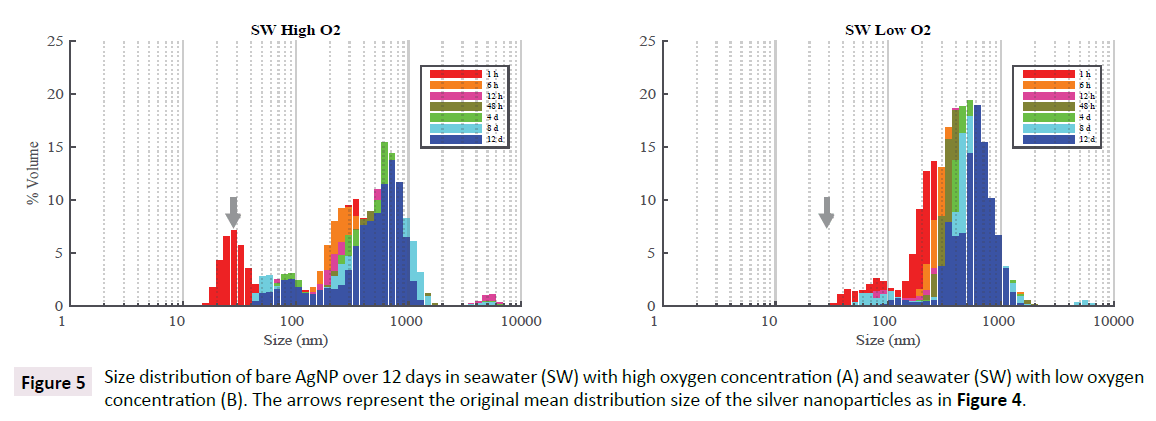
Figure 5: Size distribution of bare AgNP over 12 days in seawater (SW) with high oxygen concentration (A) and seawater (SW) with low oxygen concentration (B). The arrows represent the original mean distribution size of the silver nanoparticles as in Figure 4.
River water (RW) showed a more complex aggregation pattern with observable changes with time. Minor differences appeared between samples with high and low O2 contents and can be ignored (results not shown for low O2). In the first hour after the addition on bare AgNP, the peak of most abundant nanoparticles appeared to the left of the expected peak for bare AgNP (vertical arrow) most probably related to DLS method. With time, the larger peak was moving to the right showing a slow aggregation of AgNP and formation of a large bimodal distribution from about 30 nm up to 500 nm. Even after 12 days, monodispersed AgNP are still present indicating a long term stability of these nanoparticles in natural river water (Figure 6).
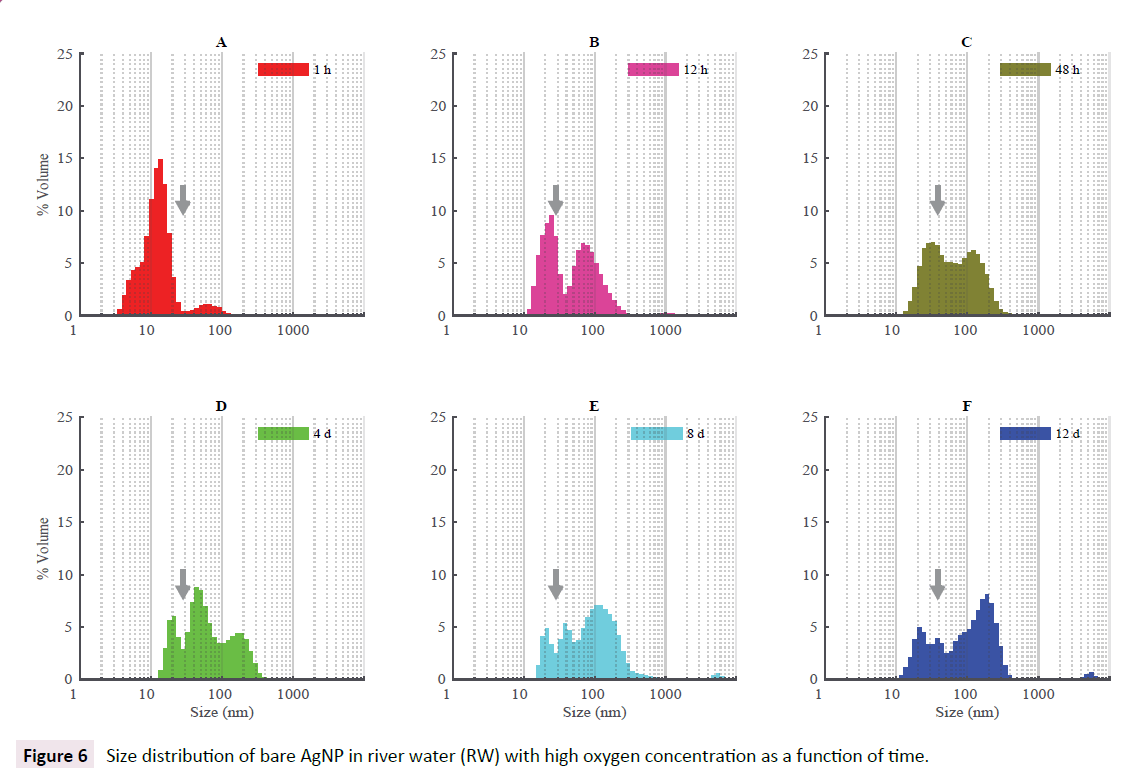
Figure 6: Size distribution of bare AgNP in river water (RW) with high oxygen concentration as a function of time.
Statistical analysis of condition impacts
Table 4 shows the result of statistical analysis of the impact of AgNP (bare and PAAm), water types (RW and SW) and dissolved oxygen (high and low) on concentration of free Ag ions in water samples. As expected from Figures 2 and 3, the nature of AgNP and the composition of water, both induced high significant differences on free Ag+ when taken individually (p<0.0001) or together (p<0.05). Dissolved oxygen did not make a difference when taken alone (p=0.840), but a significant difference is still present when combined to AgNP type (p=0.02) or water type (p=0.074). However, when all 3 factors are combined together no statistical differences disappeared which means that factors are acting in opposite direction. However, this result has to be taken with caution because of the limited number of values over a relatively short period of time (Table 4).
Discussion
Aggregation and dissolution of bare-AgNP
Bare nanoparticles prepared following the method of Li and Lenhart [29] and carefully dialyzed to remove reactants in excess, such as ionic silver and maltose residues, did not aggregate upon storage and the analysis by ICP-MS of free silver after ultracentrifugation indicated that less than 1% of total silver was in a «free Ag form». Repeated attempts to reduce again the level of ionic silver in stock solution did not succeed as a small amount of free Ag always reappeared after each dialysis. This situation is tentatively attributed to an oxidative process with the formation of Ag2O layers on the surface of nanoparticles in contact with dissolved oxygen in deionized water (DW) during treatment and the subsequent formation of ionic silver:
Ag2O + H2O → 2 Ag+ + 2OH- ……. (1)
It was previously observed that bare AgNP is electrostatically stabilized against aggregation in DW because they have negative charges on their surface layer coming from the presence of hydroxo- and oxo- groups [28]. As expected, we observed smaller aggregates in river water compared to larger aggregates in seawater as the concentration of positively charged ions in SW was over a thousand times higher than in RW. Aggregation in SW took place very early and remained relatively stable over 12 to 16 days.
Aggregation of bare AgNP in RW was observed as a slow process taking place in the first 48 h and progressing to the end of the experiment. Also observed in some distributions was the presence of small nanoparticles with diameter well below the average size of added bare AgNP. These small NP (<15 nm) were not observed by electron microscopy in bare AgNP suspension prior dissolution in RW and cannot be attributed to AgNP dissolution because of a too short time period, dissolution being a slow process. They cannot be attributed to precipitation of AgCl(s) in RW. Speciation of silver in RW using Visual MINTEQ model revealed the presence of AgCl(aq) at a high level (>60%), but solubility of AgCl in freshwater is about 1.4 mg L-1 which is about 1000 times higher than few μg/L-1 of AgCl formed in these experiments. They are more likely the result of an artefact introduced by DLS volume-based size determination as previously mentioned. Also to be considered, RW stock solution was filtered on 0.2 μm membrane before adding AgNP which could have allowed organic nanoparticles <200 nm in bottles before T0. However, repeated attempts to detect very small NP (<15 nm) in stock solutions and control samples confirmed these small NP were not detectable in sampling bottles before adding AgNP.
A sharp increase of free silver was observed for bare AgNP in both water samples at the beginning of the experiment. This behaviour cannot be attributed to a fast oxidation of A g0 at the surface of AgNP, but rather to the fast release of oxidized silver (Ag2O) entrapped at the surface of AgNP [26,27,35]. A fast release of Ag+ when uncoated Ag/Si O2 nanoparticles prepared in air were dispersed in ion-free water was previously observed [24]. Authors postulated that the release of free silver resulted from the leaching of one or two layers of oxidized Ag followed by fast dissolution of silver oxide in water. Similarly, our synthesis of bare AgNP did not exclude dissolved oxygen neither from reaction solution nor from purification and storage process, which means that bare AgNP were not protected by any coating and were sensitive to surface oxidation before dispersion in natural waters even if these nanoparticles never went dry. The same conclusion may apply to most commercially available AgNP as they are usually provided as a dry powder or in suspension without any specification about oxidized surface. It follows that the acute toxicity of AgNP to bacteria and many other aquatic organisms can be attributed, in first instance, to a fast release of Ag2O, and an oxidation process within cells is not needed at least on a short term period (<24 h) [42]. These chemical results come in support to toxicologists who recently concluded that intracellular silver release is AgNP size-dependent, but not coating dependent and a “Trojan horse” mechanism is best to explain metal cellular bioavailability [43].
We also observed that concentration of free silver was rapidly decreased in the first 24 h which is tentatively explained by a fast adsorption on inner wall of bottles (and not completely corrected by inner wall adsorption curve) and/or by a re-adsorption by nanoparticles. Evidence of adsorption of Ag+ on AgNP surface was reported in a work using citrate stabilized AgNP and DW [27]. It should be noted that the initial peak of free silver in SW was 5 times higher than in RW. The very large molar excess of chloride ions in seawater captured ionic silver as soon as available and formed soluble AgCln n-1, making the dissolution process much more efficient than in RW [25]. The precipitation of silver chloride is very unlikely in seawater and cannot explain the loss of soluble silver in SW samples.
Also to be noted, high and low levels of dissolved oxygen did not change the general pattern of dissolution of bare AgNP which is indicative that oxidation of Ag0 in natural waters is a slow process not directly influenced by dissolved oxygen changes between 2 and 13 mg·L-1 as the O2/Ag0 molar ratio in this experiment ranged between 3.6 and 34. Only reducing waters with available sulfide ions and organic reducing agents can modify dissolution process and lead to a passivation of the surface [7,27].
A lack of dissolution of bare AgNP in low ionic strength waters was expected from previous work as chloride concentration in RW is considered too low to drive the formation of silver chlorocomplexes [22,26,35]. However, dissolution of bare AgNP should have been observed in SW due to high ionic strength and high chloride concentration, well above the dissolution threshold reported by Li and Lenhart [29]. A very slow dissolution rate (0.035 μM/day) was observed in SW which is corresponding to 1.6% dissolution of added bare AgNP over 2 weeks. Reasons why bare-AgNP did not dissolve in seawater are not clear as AgNP should not be persistent in realistic environmental compartments containing dissolved oxygen [22]. An influence of Ag concentration on dissolution kinetics may be suggested, but the relatively large size of bare AgNP (33 ± 5 nm) may have play a determining role in this lack of dissolution [44]. Our results are consistent with those reported by Chinnapongse et al. where authors observed that citrate-coated AgNP (20 nm) partly agglomerated in natural pound waters and SW and persisted in suspension [45]. The coating of bare AgNP by marine dissolved organic matter (DOM) which could protect surface from oxidation and even retain adsorbed Ag+ appears to be a promising avenue to explore, but was beyond the scope of this work.
Results of dissolution of bare AgNP in RW are strongly influenced by the correction introduced to take in account the adsorption of silver ions on inner walls of HDPE bottles. Without any correction, the dissolution curve would have a negative slope indicating a precipitation process, which is not predicted under chemical conditions (low chloride and sulphur concentrations, near neutral pH and oxic waters) used in this experiment. On another hand, if the correction model overestimated the Ag adsorption in some ways, the dissolution could have been underestimated (more Ag has been dissolved in RW than calculated), particularly in the second half of the experiment. In addition, it should be noted that filtration may also have slightly underestimated the amount of dissolved silver due to adsorption of Ag+ on filters [37]. Overall, the dissolution observed here for bare AgNP in RW has to be considered as a minimum value and not a maximum one. Results of dissolution of bare AgNP in SW are not subject to above considerations as no correction has been applied.
Aggregation and dissolution of PAAm AgNP
PAAm AgNP has been used in our laboratory as a model of polymer coated silver nanoparticles to study bioaccumulation in biological tissues and toxicity mechanisms [8,46,47]. As the high molecular weight PAAm (~65,000 Da) is used as the reducing agent and each long polymer chain has many reducing sites, it is assumed that PAAm molecules are somehow integrated inside silver nanoparticles and form «hairy nanospheres» with a complex and thick coating around each nanoparticle by PAAm molecules bearing amine functional groups (NH2) along their carbon chains [36]. In some instances, PAAm can be compared to proteins which are linear high molecular weight polymers built from a series of amino acids with numerous amino groups available for reaction with metallic ions. Amines have one electron doublet available and can capture cations such as Ag+ and generate dynamic exchange within the surrounding solution. In this particular case, the polymeric coating is assumed very stable and cannot be displaced away from the surface of the nanoparticles by competing organic species. As a drawback, the excess of PAAm was difficult to remove after synthesis and the proportion of «free silver» remained relatively high (2.5%) even after a long clean-up process. PAAm AgNP stock suspensions were stable for months (without changes in aggregation and dissolution) when stored at high concentration in deionized water.
Aggregation of PAAm AgNP in RW and SW was not evidenced by available DLS technique. Hydrodynamic diameter varied between 668 and 803 nm in RW and 433 and 449 nm in SW and did not change with time (results not shown). These values are not very different from the average hydrodynamic diameter (319 nm) measured in DW. Considering strong repulsive forces generated by amine groups distributed along polymer chains, it can be hypothesized that PAAm AgNP are not subject to an important aggregation even in seawater because of strong steric and electrostatic stabilization of the PAAm polymer chains. Repeated electron microscopy observations of PAAm AgNP dispersed in RW showed mainly monodispersed nanoparticles with some small aggregates. Additional work is required to clarify factors affecting aggregation of PAAm AgNP (Figure 7).
Taking in account that total surface of bare and PAAm AgNP each bottle was about the same (73.1 and 85.6 mm2), the dispersion of PAAm AgNP in RW quickly released about 6 times more «free Ag» compared to bare AgNP. Long-term behaviour of PAAm-AgNP in RW is similar to bare AgNP with very slow dissolution, if any. This fast early release of Ag+ from PAAm-AgNP is mostly due to cationic exchange between Ag+ and competing cations in solution (Na+, K+, Mg2+, Ca2+, and others). A fast initial release of Ag+ followed by a lack of oxidative dissolution was recently reported for standard organic coated AgNP (NM-300K) in natural waters [48]. Authors suggested that some Ag+ was already present in the stock dispersion of NM-300K bound to stabilizers (polyoxyethylene glycerol trioleate and Tween-20) acting probably as a fast releasing reservoir for Ag+ and had the additional effect of later hindering the access of O2 to the AgNP surface. The polymeric coating provided by PAAm from the beginning of synthesis may have protected the AgNP from oxidation even during purification process and storage. A number of studies reported the protective effects of organic coating on AgNP and a reduction of associated toxicity [49]. Again, the role of PAAm in protecting AgNP surface in freshwater has to be explored, but was out of the scope of this work.
The situation is clearly different in seawater where a slow and constant increase of free silver is observed over time. It cannot be stated if this increase of free silver is due to a slow release of Ag+ previously captured by PAAm, or to a true dissolution of silver nanoparticles under the action of dissolved oxygen. Unexpectedly, a higher release rate was observed when PAAm- AgNP was dispersed in SW with a low O2 content [27]. This fact plays more in favour of a leaching mechanism of soluble Ag species from the polymer sphere surrounding the nanoparticle and even from the AgNP core itself than a direct oxidation of Ag0 from the surface.
Summary and Conclusion
Fate of bare and polymer coated AgNP was studied in filtered river and coastal waters under high and low O2 content, and at a constant low temperature in the dark. Similarities and differences can be summarized as following:
• Bare-AgNP slowly aggregated over days in RW, but SW induced a high agglomeration due to high ionic strength, as expected. However, low aggregation of PAAm AgNP in RW and SW was probably due to long polymeric chains bearing amine groups.
• Both bare and PAAm AgNP released immediately after dispersion a limited amount of free silver. This fast initial release is attributed to dissolution of surface Ag2O for bare nanoparticles, but appeared to be associated to Ag+ displacement from coating polymer for PAAm AgNP.
• Dissolution over two weeks was not evidenced for both bare- and PAAm AgNP in river water although dissolution of bare AgNP in RW may have been underestimated. In contrast, a slow and constant increase of free Ag+ observed for PAAm AgNP in seawater is mainly attributed to desorption of Ag+ from polymer coating although a slow oxidation and dissolution from AgNP core could also have contributed to the process.
In this experimental work with well controlled conditions to avoid some confounding factors, the fate of bare- and polymer coated AgNP can be clearly divided in two steps: A fast release of free silver very early after addition to natural waters, followed by a slow (if any) dissolution in days and weeks following the dispersion. The lack of dissolution of bare and polymer coated AgNP in low ionic strength waters was confirmed and means these nanoparticles would persist for days and weeks following their discharge and could reach estuarine waters where they are expected to slowly dissolve. This very slow dissolution of both AgNP species could be attributed (at least partly) to the presence of natural DOM present in RW and SW [31]. It should be noted that the presence of particulate organic matter as well as fine particulate clay mineral in natural waters could change this fate of AgNP by inducing hetero-aggregation and longrange transportation. This complex additional factor is under consideration in further studies with estuarine waters.
Acknowledgement
Authors thank Mathieu Babin for his help with experimental work and chemical analysis and anonymous reviewer for very appropriate and useful comments on our manuscript. This study was supported by the Natural Sciences and Engineering Research Council of Canada (NSERC) Strategic grant STPGP 412940. This project is a contribution to the research program of Québec- Océan network.
References
- Picconi FF, Gottshalk F, Seeger S, Nowark B (2012) Industrial production quantities and uses of ten ingineered nanomaterials in Europe and the world. J Nanopart Res 14: 1-11.
- Echegoyen Y, Nerín C (2013) Nanoparticle release from nano-silver antimicrobial food containers. Food Chem Toxicol 62: 16-22.
- Mackevica A, Olsson ME, Hansen SF (2017) The release of silver nanoparticles from commercial toothbrushes. J Hazard Mater 322: 270-275.
- Matsuhisa N, Inoue D, Zalar P, Jin H, Matsuba Y, et al. (2017) Printable elastic conductors by in situ formation of silver nanoparticles from silver flakes. Nat Mater 16: 834-840.
- Reidy B, Haase A, Luch A, Dawson KA, Lynch I (2015) Mechanisms of silver nanoparticles release, transformation and toxicity: A critical review of current knowledge and recommendations for future studies and applications. Materials 6: 2295-2350.
- Huang L, Dai T, Xuan Y, Tegos GP, Hamblin MR (2011) Synergistic combination of chitosan acetate with nanoparticle silver as a topical antimicrobial: Efficacy against bacterial burn infections. Antimicrob Agents Chemother 55: 3432-3438.
- Le Ouay B, Stellacci F (2015) Antibacterial activity of silver nanoparticles: A surface science insight. Nano Today 10: 339-354.
- Doiron K, Pelletier E, Lemarchand K (2012) Impact of polymer-coated silver nanoparticles on marine microbial communities: A microcosm study. Aquat Toxicol 22: 124-125.
- Fabrega J, Fawcett SR, Renshaw JC, Lead JR (2009) Silver nanoparticle impact on bacterial growth: Effect of pH, concentration and organic matter. Environ Sci Technol 43: 7285-7290.
- Fabrega J, Zhang R, Renshaw JC, Liu WT, Lead JR (2011) Impact of silver nanoparticles on natural marine biofilm bacteria. Chemosphere 85: 961-966.
- Marambio-Jones C, Hoek EMV (2010) A review of the antibacterial effects of silver nanomaterial’s and potential implications for human health and the environment. J Nanopart Res 12: 1531-1551.
- Navarro E, Piccapietra F, Wagner B, Marconi F, Kaegi R, et al. (2008) Toxicity of silver nanoparticles to Chlamydomonas reinhardtii. Environ Sci Technol 42: 8959-8964.
- Panyala NR, Peña-Méndez EM, Havel J (2008) Silver or silver nanoparticles: A hazardous threat to the environment and human health? J Appl Biomed 6: 117-129.
- Benn TM, Westerhoff P (2008) Nanoparticle silver released into water from commercially available sock fabrics. Environ Sci Technol 42: 4133-4139.
- Geranio L, Heuberger M, Nowack B (2009) The behaviour of silver nano textiles during washing. Environ Sci Technol 43: 8113-8118.
- Mitrano DM, Rimmele E, Wichser A, Erni R, Height M, et al. (2014) Presence of nanoparticles in wash water from conventional silver and nano-silver textiles. ACS Nano 8: 7208-7219.
- Gray EP, Coleman JG, Bednar AJ, Kennedy AJ, Ranville JF, et al. (2013) Extraction and analysis of silver and gold nanoparticles from biological tissues using single particle inductively coupled plasma mass spectrometry. Environ Sci Technol 47: 14315-14323.
- Hull M, Kennedy AJ, Detzel C, Vikesland P, Chappell MA (2012) Moving beyond mass: The unmet need to consider dose metrics in environmental nanotoxicology studies. Environ Sci Technol 46: 10881-10882.
- Laborda F, Bolea E, Cepri G, Gomez MT, Jimenez MS, et al. (2016) Detection, characterization and quantification of inorganic engineered nanomaterials: A review of techniques and methodological approaches for the analysis of complex samples. Anal Chim Acta 904: 10-32.
- Ho CM, Yau SKW, Lok CM, So MH, Che CM (2010) Oxidative dissolution of silver nanoparticles by biologically relevant oxidants: A kinetic and mechanistic study. Chem Asian J 5: 285-293.
- Kittler S, Greulich C, Diendorf J, Köller M, Epple M (2010) Toxicity of silver nanoparticles increases during storage because of slow dissolution under release of silver ions. Chem Mater 22: 4548-4554.
- Liu J, Hurt LH (2010) Ion release kinetics and particle persistence in aqueous nano-silver colloids. Environ Sci Technol 44: 2169-2175.
- Peretyatko TS, Khang Q, Colvin VL (2014) Size-controlled dissolution of silver nanoparticles at neutral and acidic pH conditions: Kinetics and size changes. Environ Sci Technol 48: 11954-11961.
- Sotiriou GA, Meyer A, Knijnenburg TN, Panke S, Pratsinis SE (2012) Quantifying the origin of released Ag+ ions from nanosilver. Langmuir 28: 15929-15936.
- Levard C, Mitra S, Yang T, Jew AD, Badireddy AR, et al. (2013) Effect of chloride on the dissolution rate of silver nanoparticles and toxicity to E. coli. Environ Sci Technol 47: 5738-5745.
- Li X, Lenhart JJ, Walker HW (2012) Aggregation kinetics and dissolution of coated silver nanoparticles. Langmuir 28: 1095-1104.
- Li X, Lenhart JJ, Walker HW (2010) Dissolution-accompanied aggregation kinetics of silver nanoparticles. Langmuir 26: 16690-16698.
- Levard C, Hotze EM, Lowry GV, Brown GE (2012) Environmental transformations of silver nanoparticles: Impact on stability and toxicity. Environ Sci Technol 46: 6900-6914.
- Li X, Lenhart JJ (2012) Aggregation and dissolution of silver nanoparticles in natural surface water. Environ Sci Technol 46: 5378-5386.
- Ma R, Levard C, Marinakops SM, Cheng Y, Liu J, et al. (2012) Size-controlled dissolution of organic-coated silver nanoparticles. Environ Sci Technol 46: 752-759.
- Gunsolus IL, Mousavi MPS, Hussein K, Bühlmann P, Haynes CL (2015) Effects of humic and fulvic acids on silver nanoparticle stability, dissolution and toxicity. Environ Sci Technol 49: 8078-8086.
- Tlili A, Jabiol J, Behra R, Gil-Allué C, Gessner MO (2017) Chronic Exposure effects of silver nanoparticles on stream microbial decomposer communities and ecosystem functions. Environ Sci Technol 51: 2447-2455.
- Fernandes JP, Mucha AP, Francisco T, Gomes CR, Almeida CMR (2017) Silver nanoparticles uptakes by salt marsh plants-implications for phytoremediation processes and effects in microbial community dynamics. Mar Pollut Bull 119: 176-183.
- Klaine S, Alvarez PJ, Batley GE, Fernandes TF, Handy RD, et al. (2008) Nanomaterials in the environment: Behaviour, fate, bioavailability and effects. Environ Sci Technol 27: 1825-1851.
- Dobias J, Bernier-Latmani R (2013) Silver release from silver nanoparticles in natural waters. Environ Sci Technol 47: 4140-4146.
- Sardar R, Park JW, Shumaker JS (2007) Polymer-induced synthesis of stable gold and silver nanoparticles and subsequent ligand exchange in water. Langmuir 23: 11883-11889.
- Cornelis G, Kirby JK, Beak D, Chittleborough D, McLaughlin MJ (2010) A method for determination of retention of silver and cerium oxide manufactured nanoparticles in soils. Environ Chem 7: 298-308.
- Azimzada A, Tufenkji N, Wilkinson KJ (2017) Transformations of silver nanoparticles in wastewater effluents: Links to Ag bioavailability. Environ Sci Nano.
- Sekine R, Khurana K, Vasilev K, Lombi E, Donner E (2015) Quantifying the adsorption of ionic silver and functionalized nanoparticles during ecotoxicity testing: Test container effects and recommendations. Nanotoxicology 9: 1005-1012.
- Wen LS, Santschi PH, Gill GA, Tang D (2002) Silver concentrations in Colorado, USA watersheds using improved methodology. Environ Toxicol Chem 21: 2040-2051.
- Angel BM, Batley GE, Jarolimek CV, Rogers NJ (2013) The impact of size on the fate and toxicity of nanoparticulate silver in aquatic systems. Chemosphere 93: 359-365.
- Liu J, Wang Z, Liu FD, Kane AB, Hurt RH (2012) Chemical transformation of nanosilver in biological environments. ACS Nano 6: 9887-9899.
- Gliga AR, Skoglund S, Wallinger IO, Fadeel B, Karlsson HL (2014) Size-dependent cytotoxicity of silver nanoparticles in human lung cells: The role of cellular uptake, agglomeration and Ag release. Part Fibre Toxicol 11: 11.
- Zhang W, Yao Y, Sullivan N, Chen Y (2011) Modelling the primary size effects of citrate-coated silver nanoparticles on their ion release kinetics. Environ Sci Technol 45: 4422-4428.
- Chinnapongse SL, MacCuspie RI, Hackley VA (2011) Persistence of singly dispersed silver nanoparticles in natural freshwaters, synthetic seawater and simulated estuarine waters. Sci Total Environ 409: 2443-2450.
- Al-Sid-Cheikh M, Pelletier E, Rouleau C (2011) Synthesis and characterization of [(110m)Ag]-nanoparticles with application to whole-body autoradiography of aquatic organisms. Appl Radiat Isotopes 69: 1415-1421.
- Magesky A, Pelletier E (2015) Toxicity mechanisms of ionic silver and polymer-coated silver nanoparticles with interactions of functionalized carbon nanotubes on early development stages of sea urchin. Aquat Toxicol 167: 106-123.
- Köser J, Engelke M, Hoppe M, Nogowski A, Filser J, et al. (2017) Predictability of silver nanoparticle speciation and toxicity in ecotoxicological media. Environ Sci Nano.
- Navarro E, Wagner B, Odzak N, Sigg L, Behra R (2015) Effects of differently coated silver nanoparticles on the photosynthesis of Chlamydomonas reinhardtii. Environ Sci Technol 49: 8041-8047.