Esraa H AL-Maini1, Layla H Hamad2, Nadia D Yassir1 and Samera H Hamad3*
1Department of Obstetrics and Gynecology; AL-Yarmouk Teaching Hospital, AL- Mustansiriya University, College of Medicine, Baghdad, Iraq
2Department of Obstetrics and Gynecology; Baghdad Teaching Hospital, Bab Al-Muadham, Baghdad, Iraq
3Department of Behavioral and Community Health; the University of Maryland, School of Public Health, College Park, USA
Corresponding Author:
Samera H Hamad
Department of Behavioral and Community Health
the University of Maryland
School of Public Health, College Park, USA
Tel: +608-217-3839
E-mail: shamad@umd.edu
Received Date: March 25, 2017; Accepted Date: April 10, 2017; Published Date: April 20, 2017
Citation: AL-Maini EH, Hamad LH, Yassir ND, et al. Hemoglobin A1c and Umbilical Cord Components: Prediction of Fetal Macrosomia in Women with Gestational Diabetes Mellitus. Eur Exp Biol. 2017, 7:13. doi:10.21767/2248-9215.100013
Copyright: © 2017 Hamad SH, et al. This is an open-access article distributed under the terms of the Creative Commons Attribution License, which permits unrestricted use, distribution, and reproduction in any medium, provided the original author and source are credited.
Keywords
HbA1c ; Wharton’s jelly; Diabetic women; Macrosomia
Introduction
Fetal macrosomia is a risk factor for delivery complications for mothers and newborns [1]. It is associated with the gestational diabetes, but can occur in other pregnancies. About 2-9% of all pregnant women are diagnosed with gestational diabetes [2]. The American College of Obstetricians and Gynecologists (ACOG) defines macrosomia as a birth weight that is >4,000 g irrespective of gestational age, or >90th percentile for gestational age after correcting for neonatal sex and ethnicity [3]. Health professionals have used ultrasound-derived estimated fetal weight and glycated hemoglobin (HbA1c ) levels to predict the risk of macrosomia during pregnancy [4]. However, these findings still have not received a consensus agreement on the accuracy of both approaches. Additionally, professional groups disagree on whether to recommend routine screening, selective screening based on risk factors for gestational diabetes, or no screening [2,5,6]. Given the serious problems that might be associated with delivery of the macrocosmic fetus, identification of at risk fetuses and treatment of gestational diabetes to control the maternal glucose levels are both important risk-reduction strategies.
Sonographic prediction of fetal weight in large for gestational age fetuses based on weight estimation equations is associated with overestimation and the reliability of these methods, has been questioned by some authors [7,8]. Studies have shown that the use of umbilical cord components and glycated hemoglobin (HbA1c) levels can give more accurate results to predict macrosomia [4] while others showed that HbA1c levels cannot be used to predict macrosomia [9]. Study the agreement of both approaches is important to predict macrosomia. Therefore, we aimed to understand the importance of measuring HbA1c along with umbilical cord components by sonographic examination in prediction of macrosomia in women with gestation diabetes mellitus.
Methods
Participants
Randomly, ninety pregnant women were divided into two groups: 45 diabetic women (study group) and 45 non-diabetic women (control group), were included in the study. Examination of pregnant women took place in AL-Yarmouk Teaching Hospital, Baghdad, Iraq from August 2015 to August 2016, during routine antenatal assessment. All pregnant women included in this study were in the third trimester of a singleton pregnancy. All diabetic women (study group) were diagnosed with gestation diabetes mellitus and treated with insulin. Oral glucose tolerance testing (OGGT) was used to test the control group.
The gestational age was calculated based on the last menstrual period and confirmed measurement of grown–rump length and second trimester ultrasound at <20 weeks. Pregnant women with rupture membrane, and multiple pregnancies, medical disorders (e.g. Renal, cardiovascular diseases, pulmonary diseases or/and hypertension), Polyhydramnios or oligohydramnios, Intrauterine growth retardation, placenta previa and abruption, fetal congenital abnormality or smoker, were all excluded from this study. Verbal consent was obtained from each woman before the examination. A complete evaluation for each pregnant woman was done including detailed history of age, gravidity, parity, history of previous diabetes mellitus, hypertension or any medical diseases and a previous delivery of large baby. The diagnosis of gestational diabetes was depending on the Oral Glucose Tolerance Test (the American Diabetes Association criteria). HbA1c levels were measured for all both groups (study and control). The study protocol was approved by Obstetrics and Gynecology committee of Arabic Board for medical specialization and the hospital administration.
Ultrasound examination
Both groups of pregnant women were subject to ultrasonographic examination. During ultrasound examinations, fetal anthropometric parameters, biparietal diameter, abdominal circumference, femur length and estimated fetal weight (which were calculated automatically according to Hadlock’s formula) were measured. Additionally, the sonographic cross-sectional areas of the umbilical cord and the umbilical vessels were measured in a free loop of the umbilical cord using ultrasound machine with convex transducer frequency of 3.5 Megahertz (Philip, HD 11 XE). The cross-sectional area of Wharton’s jelly was computed by subtracting the cross-sectional area of the vessels from that of the umbilical cord. Fetal macrosomia was considered to be present when neonatal weight was equal or higher than 4,000 g [3].
HbA1c analysis
Hemoglobin A1c is defined as the hemoglobin that is irreversibly glycated at one or both N-terminal valines of the beta chains [10,11]. 3 ml of venous blood samples were collected from each women, placed in anti- coagulant tube (tubes with EDTA). Immunoturbidimetric method (standardized by DCCT: Diabetes Control and Complications Trial and certificate by NGSP: National Glycohemoglobin Standardization Program) [12] was used to determine total hemoglobin calorimetrically using alkaline hematin.
Babies’ body weight
After delivery, babies’ body weights were assessed using the neonatal scale.
Statistical analysis
Regression model embedded in Microsoft Excel 2010 was used to compare the results of umbilical cord components and the levels of HbA1c in diabetic pregnant women with those in non-diabetic women. Results are considered to be statistically significant if p-value is less than 0.05.
Results
The demographic characteristics of diabetic and non-diabetic pregnant women are presented in Table 1. Results show that the mean age, gravity and parity were significantly higher in diabetic women than non-diabetic women. Gestational age at delivery was not statistically different; but the rate of cesarean section was significantly higher (71%) for women with diabetes compared to women with no diabetes mellitus (13%). These results are concordant with what has been previously published [13]. Vaginal delivery showed lower rate (31%) for diabetic women compared to non-diabetic women (69%).
| Name |
Diabetic patients (Mean value) |
Non diabetic patients (Mean value) |
p-Value |
| Age (year) |
31.5 |
26.2 |
<0.05 |
| Gravidity* (n) |
3.4 |
2.6 |
<0.05 |
| Parity** (n) |
2.4 |
1.6 |
<0.05 |
| Fetusweight (g) |
3,340 |
3,040 |
<0.05 |
| Gestational age at delivery time (week) |
38.4 |
38.6 |
NS*** |
| Cesarean section n (%) |
32 (71%) |
14 (31%) |
<0.01 |
| Vaginal delivery n (%) |
13 (29%) |
31(69%) |
<0.01 |
*defined as the number of times that a woman has been pregnant
**defined as the number of times that she has given birth to a fetus with a gestational age of 24 weeks or more, regardless of whether the child was born alive or was stillborn
*** Not Significant
Table 1: Demographic characteristics of diabetic and non-diabetic pregnant women.
Results of umbilical cord components of the diabetic women (study group) and non-diabetic women (control group) were presented in Table 2. Mean value of cross sectional area of umbilical cord of study group was significantly (p<0.05) higher in women with diabetes mellitus compared with the control group (Figure 1). Wharton's jelly was also significantly higher (p<0.05) in the diabetes mellitus group compared to control group.
| Patients |
Mean ± STD |
p-Value |
| Cross sectional area of umbilical cord (mm2) |
Study group |
282 ± 50 |
<0.05 |
| Control group |
208 ± 31 |
| Umbilical cord thickness (Wharton's jelly) (mm2) |
Study group |
164 ± 52 |
<0.05 |
| Control group |
127 ± 26 |
Table 2: Umbilical cord components of diabetic (n=45) and nondiabetic pregnant women (n=45).
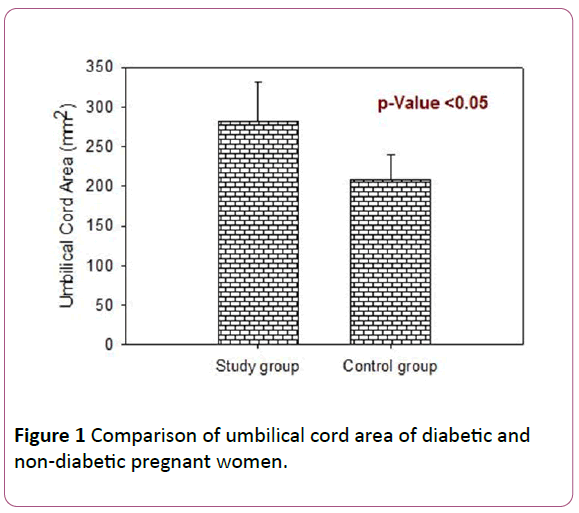
Figure 1: Comparison of umbilical cord area of diabetic and non-diabetic pregnant women.
HbA1c levels are presented in Table 3. Results show that 11 of 45 diabetic women had HbA1c higher than 45 mmol/mol; five women had an HbA1c between 30 mmol/mol and 45 mmol/mol; and 29 women had HbA1c that is lower than 30 mmol/mol. Additionally, HbA1c levels were related with the weight of the fetus. Table 3 show that 16 of 45 (36%) of diabetic women had macrosomic fetuses; and 11 of them (69%) had HbA1c that is higher than 45 mmol/mol. In the control group (non-diabetic pregnant women), there has been 12 of 45 (27%) of the cases that had constitutionally macrosomic fetuses.
| |
Number of cases (n) |
HbA1c (mmol/mol) |
Weight of fetus (g) |
| Diabetic pregnant women n=45 |
11 |
≥45 |
≥ 4,000* |
| 5 |
30< × <45 |
| 29 |
≤ 30 |
≤ 3,450 |
| Non-diabetic pregnant women n=45 |
12 |
≤ 27 |
≥4,000 |
| 33 |
≤ 25 |
3,000 ≤ ×≤ 3,250 |
| *Weight of fetus that is >4,000 g, is an indicator of macrosomia |
Table 3: HbA1c levels for diabetic pregnant women related macrosomia.
Regression lines showed correlation (R2=0.55) between fetus weight and Wharton’s jelly (umbilical cord thickness); and good correlation (R2=0.84) between fetus weight and HbA1c levels in 16 of 45 diabetic women. Correlation was also found between the weight of fetus and Wharton’s jelly (R2=0.68) with no correlation between fetus weight and HbA1c levels (R2=0.34) in 29 of 45 diabetic women (Figure 2). No correlation was found among these variables (i.e. fetus weight, Wharton’s jelly, and HbA1c levels) in the control group (data is not shown here).
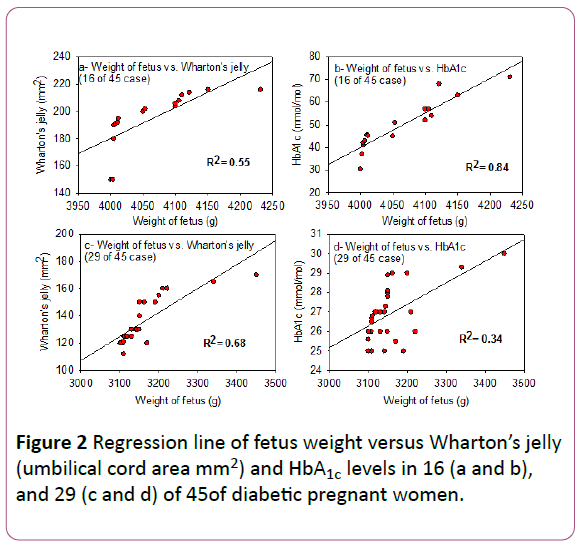
Figure 2: Regression line of fetus weight versus Wharton’s jelly (umbilical cord area mm2) and HbA1c levels in 16 (a and b), and 29 (c and d) of 45of diabetic pregnant women.
Discussion
Infant macrosomia was a mediating factor in high cesarean delivery rate for women with diabetes. This study shows that 16 of 45 diabetic women delivered macrosomic infants. Additionally, 12 of 45 cases in the control group (women with no diabetes mellitus) delivered constitutionally macrosomic infants. Cesarean section rate in diabetic women was higher than that for the control group (32(71%) versus 14(31%)); these results agreed with what has been published before [14].
It has been found that the large umbilical cord area is attributed to the large amount of Wharton's jelly in diabetic mothers; this was attributed to the increase in the permeability of umbilical vessels in diabetes mellitus that increases the plasma protein leakage in the interstitial space [15].
Our results show that the infant of diabetic mother has large umbilical cord area due to a large amount of Wharton's jelly. This might differentiate between the appropriate-forgestational- age fetus from a normal pregnancy and that from a pregnancy in a mother with gestational diabetes, and between the macrosomic fetus of a diabetic pregnancy from the genetically large fetus [15].
Association between HbA1c levels and risk of macrosomia has been investigated before [9,16,17]. However, positive correction was found between HbA1c levels and risk of macrosomia in some studies [16,17]; while other studies showed no association between the levels of HbA1c and risk of macrosomia [9]. Our results showed that 16 of 45 of diabetic pregnant women had macrosomic fetuses, and 11 of them had high HbA1c (Table 3). This study combined the HbA1c levels with the umbilical cord components (i.e Wharton’s jelly) to increase the sensitivity of prediction of macrosomia [4]. The weight of macrosomic fetuses of diabetic mothers showed positive correlation with the HbA1c levels (Figure 2b). This has been further confirmed by the positive correlation between the weight of macrosomic fetuses and the umbilical cord area (Wharton’s jelly) (Figure 2a) which imply that, in addition to the umbilical cord components, HbA1c levels could also be used to predict macrosomic fetuses [18]. Although, positive association was found between the weight of fetuses and the umbilical cord components in 29 of 45 of diabetic mothers (Figure 2c), no association was observed between the weight of fetuses and the HbA1c (Figure 2d). However, there was no macrosomia in these cases and the HbA1c level was normal (Figure 2c and 2d).
Acknowledgment
Authors would like to thank the staff of clinical biochemistry department at AL-Yarmouk Hospital for their help in HbA1c analysis.
References
- Mohammadbeigi A, Farhadifar F, Soufi Zadeh N, Mohammadsalehi N, Rezaiee M, et al. (2013) Fetal macrosomia: risk factors, maternal, and perinatal outcome. Ann Med Health Sci Res 3: 546-550.
- Hoffman L, Nolan C, Wilson JD, Oats JJ, Simmons D (1998) Gestational diabetes mellitus-management guidelines-The Australasian Diabetes in Pregnancy Society. Med J Aust 169: 93-97.
- Ng SK, Olog A, Spinks AB, Cameron CM, Searle J, et al. (2010) Risk factors and obstetric complications of large for gestational age births with adjustments for community effects: results from a new cohort study. BMC Public Health 10: 460.
- Binbir B, Yeniel AO, Ergenoglu AM, Kazandi M, Akercan F, et al. (2012) The role of umbilical cord thickness and HbA1c levels for the prediction of fetal macrosomia in patients with gestational diabetes mellitus. Arch Gynecol Obstet 285: 635-639.
- Seshadri R (2002) American diabetes association gestational diabetes mellitus. Diabetes Care 25: S94-S96.
- Solomon MJ, McLeod RS (1994) Periodic health examination, 1994 update: 2. Screening strategies for colorectal cancer. Canadian Task Force on the Periodic Health Examination.CMAJ 150: 1961-1970.
- Sokol RJ, Chik L, Dombrowski MP, Zador IE (2000) Correctly identifying the macrosomic fetus: improving ultrasonography-based prediction. Am J Obstet Gynecol 182: 1489-1495.
- Hirata GI, Medearis AL, Horenstein J, Bear MB, Platt LD (1990) Ultrasonographic estimation of fetal weight in the clinically macrosomic fetus. Am J Obstet Gynecol 162:238-242.
- Katon J, Reiber G, Williams MA, Yanez D, Miller E (2012) Antenatal haemoglobin A1C and risk of large-for-gestational-age infants in a multi-ethnic cohort of women with gestational diabetes. Paediatr Perinat Epidemiol26:208-217.
- Jeppsson JO, Kobold U, Barr J, Finke A, Hoelzel W, et al. (2002) Approved IFCC reference method for the measurement of HbA1c in human blood. Clin Chem Lab Med 40: 78-89.
- Hoelzel W, Miedema K (1996) Development of a reference system for the international standardization of HbA1c/glycohemoglobin determinations. J Int Fed Clin Chem 8: 62-64, 66-7.
- No authors (2016) IFCC Standardization of HbA1c. NGSP.
- Ovesen PG, Jensen DM, Damm P, Rasmussen S, Kesmodel US (2015) Maternal and neonatal outcomes in pregnancies complicated by gestational diabetes. A nation-wide study. J Matern Fetal Neonatal Med28:1720-1724.
- Naylor CD, Sermer M, Chen E, Sykora K (1996) Cesarean delivery in relation to birth weight and gestational glucose tolerance: pathophysiology or practice style? Toronto Trihospital Gestational Diabetes Investigators. JAMA 275: 1165-1170.
- Weissman A, Jakobi P (1997) Sonographic measurements of the umbilical cord in pregnancies complicated by gestational diabetes. J Ultrasound Med 16: 691-694.
- Mikkelsen MR, Nielsen SB, Stage E, Mathiesen ER, Damm P (2011) High maternal HbA1c is associated with overweight in neonates. Dan Med Bull 58: A4309.
- Baxi L, Barad D, Reece EA, Farber R (1984) Use of glycosylated hemoglobin as a screen for macrosomia in gestational diabetes. Obstet Gynecol 64: 347-350.
- Holmstrom SW, Botelho J, Downes K, Lynch C (2012) Hemoglobin A1C as a Predictor of Fetal Macrosomia. J Women’s Health Care 1: 11.

