Jianying Shen1*,2, Qingsheng Yu3, Xiaoqiang Li1, Rujing Ren1 and Yuqing Tan1
1Institute of Chinese Materia Medica, China Academy of Chinese Medical Sciences, Nanxiaojie, Beijing 100700, China
2Department of Diabetes and Metabolic Disease Research, Beckman Research Institute, City of Hope, Duarte, CA 91010, USA
3Beijing Key Lab for Immune-Mediated Inflammatory Diseases, China-Japan Friendship Hospital, Beijing 100029, People’s Republic of China
*Corresponding Author:
Jianying Shen
Institute of Chinese Materia Medica
China Academy of Chinese Medical Sciences
No. 16, Nanxiaojie, Dongzhimen Nei Ave
Beijing 100700, China
Tel: 861084252805
E-mail: jyshen@icmm.ac.cn
Received Date: January 19, 2017; Accepted Date: February 09, 2017; Published Date: February 15, 2017
Citation: Shen J, Yu Q, Li X, et al. Genome- Wide DNA Methylation Profiling in Diabetogenic and Regulatory T Cells from NOD Mice. J Clin Epigenet. 2017, 3:1. doi:10.21767/2472-1158.100039
Copyright: © 2017 Shen J, et al. This is an open-access article distributed under the terms of the Creative Commons Attribution License, which permits unrestricted use, distribution, and reproduction in any medium, provided the original author and source are credited.
Keywords
Methylation; Type 1 diabetes; Epigenetics; Autoimmune disease; T cell
Introduction
Type 1 Diabetes (T1D) is an autoimmune disease resulting from selective destruction of insulin-producing pancreatic islet β cells. Previous studies have shown that Monozygotic (MZ) twin pair discordance for childhood-onset T1D is ~ 50% [1,2], implicating that the etiology of T1D involves both genetic and non-genetic components. Many studies have demonstrated the important role of genetic factors in T1D development. For example, it is well established that the major T1D susceptibility locus in human is mapped to the human leukocyte antigen (HLA) class II gene region at chromosome 6p21 [3-6]. Among the most disease-associated HLA alleles, DR3-DQA1*0501-DQB1*0201 (DR3) and DR4-DQA1*0301-DQB1*0302 (DR4) haplotypes account for 30- 50% of T1D incidence in Caucasian population [6]. In addition, other than the HLA genes, genome-wide association studies (GWAS) have also identified more than 40 non-HLA susceptibility loci that may contribute to T1D [7-9]. However, unexpectedly, previous studies also demonstrated that the percentage of T1D cases with high-risk HLA susceptibility genes, such as the DR3/4 genotype, is decreasing as the T1D incidence increases [10,11]. These results suggest the contribution of non-genetic components to the development of T1D.
Emerging evidence has demonstrated that epigenetics is an important non-genetic component in regulating T1D development. Epigenetic changes, including DNA methylation and histone modifications, can be induced by environmental variants including dietary factors and infectious agents and can regulate gene expression levels [12-14]. Therefore, regulation of epigenetic changes is considered an important alternative mechanism to modulate gene expression and functions [15]. An epigenetic study, comparing genome-wide histone H3 lysine 9 dimethylation (H3K9me2) patterns in peripheral blood from T1D patients vs. healthy subjects, has shown that lymphocytes from these two cohorts display a distinct profile of H3K9me2 [16]. In addition, H3K9me2 alteration was detected at the promoter region of CTLA4, one of the T1D susceptibility genes. Studies of other autoimmune disorders, including Systemic Lupus Erythematosus (SLE) and rheumatoid arthritis(RA), further showed that the methylation status of genomic DNA and specific autoimmunity-related genes are altered in patients, leading to autoreactivity [17-19]. A recent study using a systematic analysis of the temporal origins of T1D-associated epigenetic variations, epigenome-wide association study (EWSA), has generated genome-wide DNA methylation profiles of purified CD14+ monocytes from 15 T1D-discordant MZ twin pairs [20]. The results demonstrated the presence of T1D-specific methylation variable positions (T1D-MVPs) in the T1D-affected co-twins. These T1D-MVPs may have arised during the etiological process that leads to overt T1D. Overall, these studies revealed an important role of epigenetic mechanisms in controlling autoimmune diseases, including T1D.
Both Foxp3+CD4+ regulatory T cells (Tregs) and antigen-expanded Foxp3-CD4+ Tregs are important for maintaining immune tolerance and preventing autoimmune diseases, by suppressing pathogenic T cells (Tpaths) [21-28]. These studies suggest that an increased population of autoreactive Tpaths, the presence of Tregs-resistant Tpaths, or a defective population of Tregs may lead to development of diabetes. Therefore, to re-establish a well-balanced population of functionally potent Tregs vs. Tpaths is necessary to help a diabetic patient regain control of their health. To aid in achieving this goal to treat diabetic patients, it is important to understand the molecular mechanisms modulating the homeostatic balance of these functionally varied T cells.
In this study, we performed comparative DNA methylation microarray analyses of Tpaths, Tregs, and a control non-Tpath, non-Treg T cell line (Tctrl). Based on these genome-wide analyses, our studies have found that Tpaths and Tregs have different methylation density distribution in their autosomes and chromosome X. These novel results suggest epigenetic differences may contribute to the functional differentiation/specification of Tpaths vs. Tregs [29-43].
Materials and Methods
Cells CD4+BDC cells(Tpath) [44,45], N79 cells(Tctrl) [46], and two Treg cell lines [47,48], N206 (Treg 1) and NR206 (Treg 2), have been previously described. The features of the cell lines were summarized in Table 1. Ten days after being activated by their activating peptides, the cells were used in the study.
| Cell lines |
Features |
| N79 |
A CD4+ T cell line, recognizing a mimotope p79 peptide, functions neither as Treg nor Tpath, and is used as functionally neutral control (Tctrl). |
| BDC |
CD4+ BDC cells, isolated from the BDC mice, were cultured and activated three times by the p79 peptide in vitro .These BDC cells are able to induce an aggressive form of T1D when transferred to NOD/SCID mice (Tpath). |
| N206 |
A GAD peptide p206-specific CD4+ Treg line isolated from nonobese diabetic (NOD) mice, does not require cell contact, but it inhibits Tpath proliferation and prevents T1D in adoptive transfer experiments (Treg1). |
| NR206 |
A p206-specific Treg line isolated from nonobese diabetes-resistant (NOR) mice, is dependent on both IFN-γ production and cell contact with target cells (Treg2). |
Table 1 The features of four cells used in the study.
Genomic DNA purification and enrichment of methylated CpG sequences
Genomic DNA was purified using proteinase K digestion. Methylated DNA enrichment was performed as described previously with minor modifications (Rauch and Pfeifer 2010). Briefly, a glutathione-Sepharose CL-4B matrix (Amersham Biosciences, Piscataway) was used to elute puri- fied GST-tagged MBD2b protein with elution buffer, which contained 0.1% Triton X-100, 150 mM NaCl, 50 mM Tris·HCl, pH 8.5 and 20 mM glutathione, at 4°C. Phosphate buffered saline (PBS) was used for dialysis of the eluted GST-MBD2b fraction for 5 h, followed by overnight dialysis in buffer containing 150 mM NaCl, 50 mM Hepes, pH 7.4, 50% (v/v) glycerol and 5 mM 2-mercaptoethanol. GST-tagged MBD2b protein was kept at −20âÂâ€â€Â¦C. Genomic DNA fragments digested by MseI were ligated with linker. Then, after overnight incubation with GST-MBD2b and HisMBD3L1 proteins, MagneGST beads (2.5 μL) (Promega, Madison, USA) which were preblocked by JM110 bacterial DNA, were added into the reaction mixture and incubated at 4âÂâ€â€Â¦C for 45 min. Beads were washed thrice with washing buffer which contained 700 mM NaCl,10 mM Tris·HCl, pH 7.5, 0.1% Triton X-1001 mM EDTA and 3 mM MgCl2. Qiaquick PCR purification kits (Qiagen, Valencia, USA) were used to elute the methylated CpG-enriched fraction. The number of replicated used for MIRA microarray was one.
Definition of CpG methylation peaks: Log2 ratios between MIRA-enriched and input DNA samples were generated using NimbleScan software (Roche NimbleGen) and further processed by Quantile normalization. Probes with log2 ratios greater than 1 (2-fold enriched) were selected as positive. A methylation peak was defined as a region with at least two positive probes covering a minimum length of 250 bp allowing one probe gap, and then mapped relative to known transcripts defined in the UCSC genome browser mm8 RefSeq database. Methylation peaks falling into 1500 bp relative to transcription start sites were defined as ‘promoter’; methylation peaks falling within 1500 bp of RefSeq transcript end sites were defined as ‘downstream’, and those falling within gene bodies (from 1500 bp downstream of transcription start to 1500 bp upstream of the transcript end) were defined as ‘intragenic’ peaks.
Results
Comparative analyses of total methylation peaks in Tpath vs. Tregs.
To gain insights into the potential epigenetic control of the function of CD4+ Tpaths vs. Tregs, we performed comparative genome-wide DNA methylation microarray analyses (methylated CpG island recovery assay, MIRA) of a diabetogenic Tpath (BDC), a non-Tpath/non-Treg control cell Tctrl (N79), and two Treg lines (Treg 1 for N206 and Treg 2 for NR206) (Table 1). The log2 ratios of MIRA signals vs. input were obtained by NimbleGen software with Quantile normalization. The results of probes were considered as positive if their log2 ratios were >2-fold. For our analyses, a methylation peak is defined as having at least 2 positive probes covering a minimum length of 250 bp DNA, allowing no more than a 1-probe gap.
A total of 2204 methylation peaks were positively detected from the CpG methylation array, with 1421, 1493, 1254, and 1159 methylation peaks identified in Treg1, Treg2, Tctrl, and Tpath, respectively. To further analyze the positively detected methylation peaks, we have used the venn diagram (Figure 1) to display the relative number of the common and different methylation peaks in these cells. These results showed that Tpath and Tctrl shared 844 common methylation peaks, while Tpath has 315 and Tctrl has 410 unique methylation peaks. For Treg1 and Treg2, they have 1228 common methylation peaks, while Treg1 has 193 and Treg2 has 265 unique methylation peaks. In addition, there were 635 methylations peaks detected either in Treg1 or Treg2 but not in Tpath or Tctrl, whereas 518 methylation peaks were detected either in Tpath or Tctrl but not in the two Tregs. Our results further showed that ~70% (844/1159=72% for Tpath, and 844/1254=68% for Tctrl) of the methylation peaks were overlapped between Tpath and Tctrl. In comparison, N206 and NR206 Tregs have ~84% (1228/1421=86% for Treg1, and 1228/1493=82% for Treg2) of their methylation peaks overlapped. Altogether, these results indicate that the two Tregs have very similar methylation patterns that are distinct from those found in the Tpath and Tctrl.
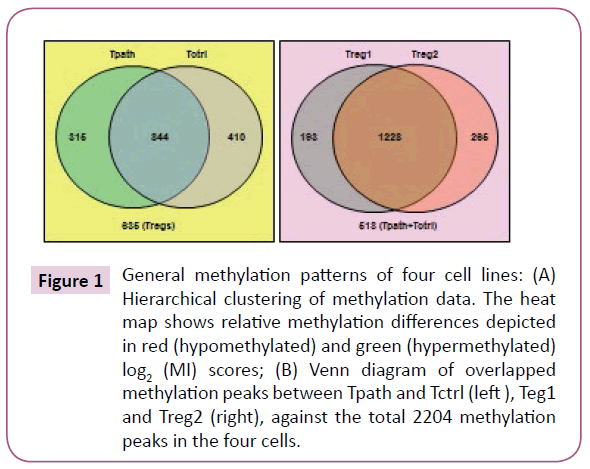
Figure 1: General methylation patterns of four cell lines: (A) Hierarchical clustering of methylation data. The heat map shows relative methylation differences depicted in red (hypomethylated) and green (hypermethylated) log2 (MI) scores; (B) Venn diagram of overlapped methylation peaks between Tpath and Tctrl (left ), Teg1 and Treg2 (right), against the total 2204 methylation peaks in the four cells.
To further analyze the location of various methylation peaks within different regions of certain genes, we adopted the RefSeq gene definition from the University of California at Santa Cruz (UCSC) Genome Browser for mouse (mm8, 22,307 genes) genome. For our analyses, we grouped methylation peaks into four classes (promoter regions, intragenic regions, downstream regions and intergenic regions) based on their distance to RefSeq genes, as defined in Materials and Methods. Based on these definitions, 27-30% of the methylation peaks in each of the four cells is located in the promoter regions, 52-59% in the intragenic regions, and 3% in the downstream regions of a gene. Additionally, 8-15% of methylation peaks are located in the intergenic regions (Figure 2a). Furthermore, there is no difference in the percentage of methylation peaks located in different regions of genes among these cells. Therefore, the number and location of the methylation peaks in different gene regions may not be important for the distinct functions of these T cells. We then analyzed the DNA methylation patterns on each of the 19 autosomes and the X chromosome in the genome of the cells. Our initial analyses showed that the number of methylation peaks along various chromosomes in each type of cells is not proportional to the chromosome size (Figure 2b). These analyses also showed that Tregs have generally higher methylation peaks density (peak number/Mb) than do Tpath and Tctrl on autosomes, except for Chromosome 19 having similar methylation peaks density in these cells. In contrast, unexpectedly, we found that the Chromosome X in Tpath has a significantly higher (~2.5 folds, with 97/166.7 for Tpath, and 39/166.7 for Tregs) methylation peaks density than those in the two Tregs. In addition, the Tpath also has the highest percentage (8%) of their methylation peaks located on Chromosome X (Figure 2c). In comparison, the two Tregs only have 3% and the Tctrl has 4% of their total methylation peaks located on Chromosome X.
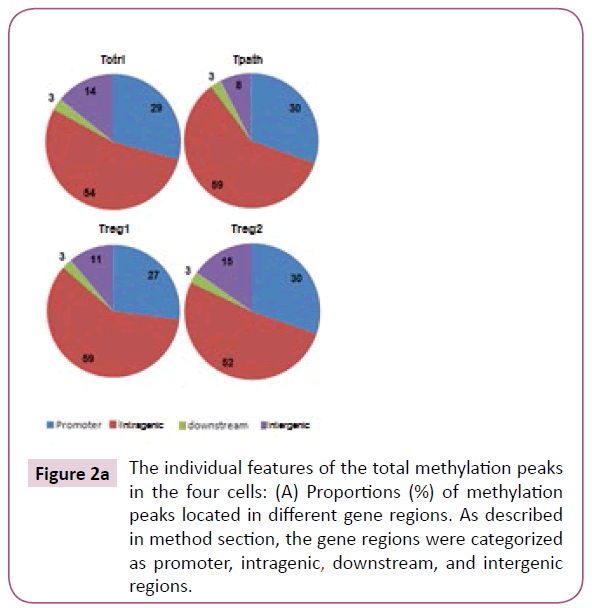
Figure 2a: The individual features of the total methylation peaks in the four cells: (A) Proportions (%) of methylation peaks located in different gene regions. As described in method section, the gene regions were categorized as promoter, intragenic, downstream, and intergenic regions.
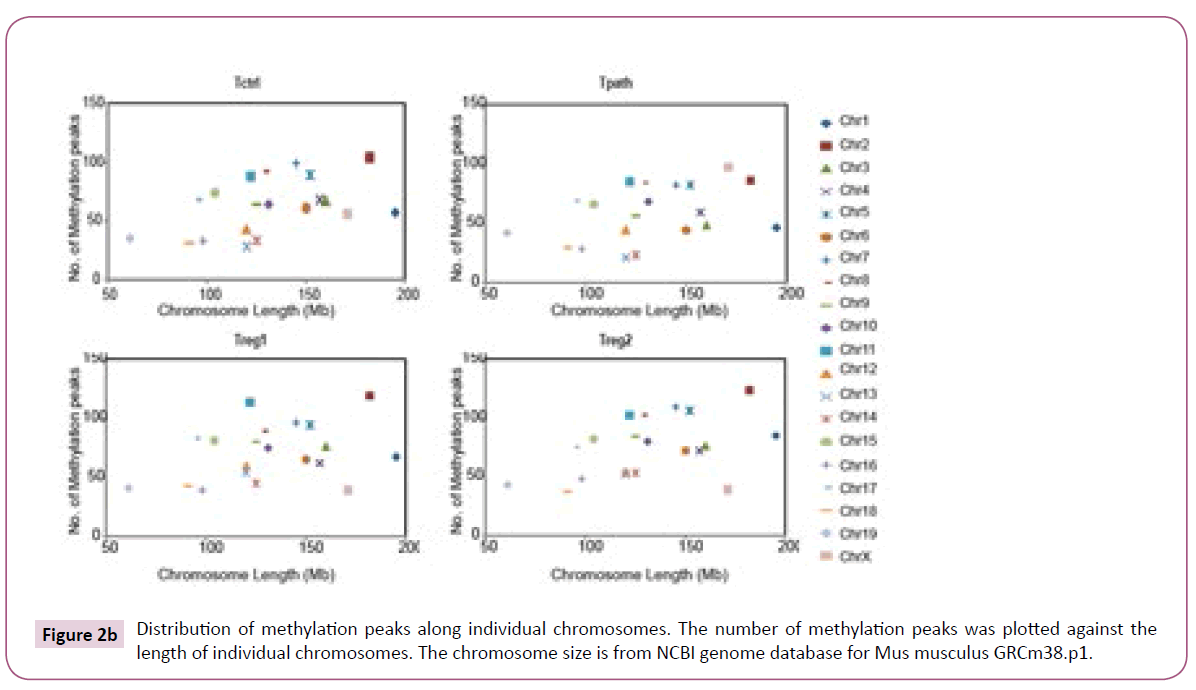
Figure 2b: Distribution of methylation peaks along individual chromosomes. The number of methylation peaks was plotted against the length of individual chromosomes. The chromosome size is from NCBI genome database for Mus musculus GRCm38.p1.
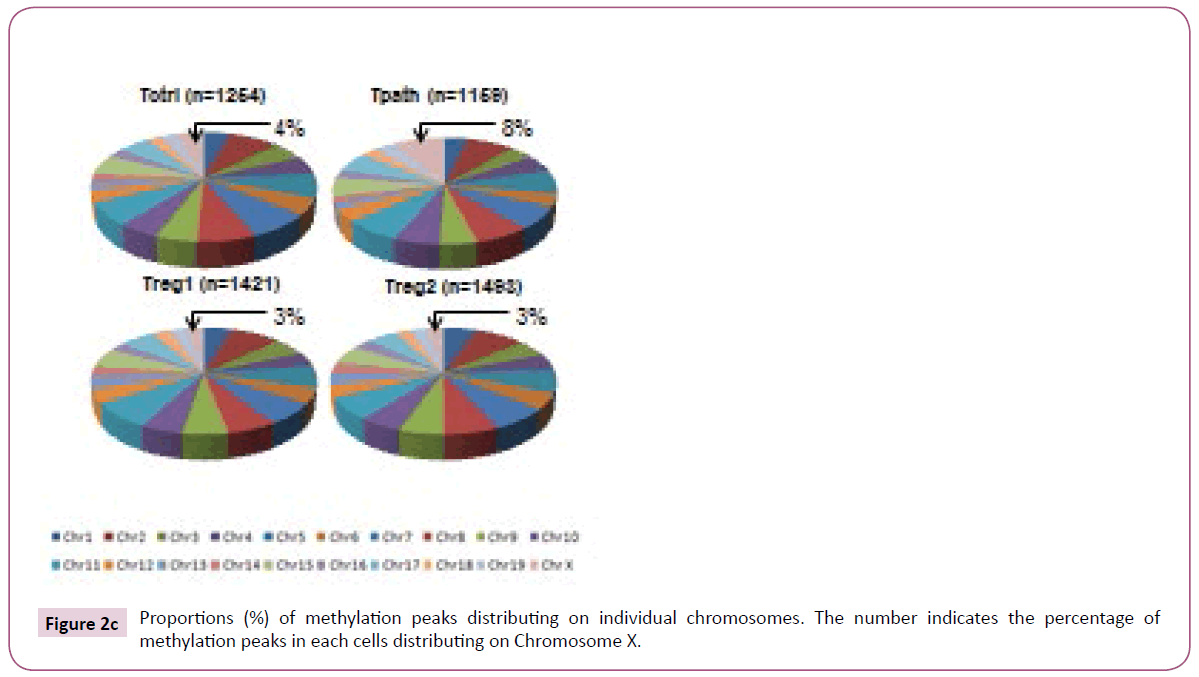
Figure 2c: Proportions (%) of methylation peaks distributing on individual chromosomes. The number indicates the percentage of methylation peaks in each cells distributing on Chromosome X.
These results suggest that higher methylation density on Chromosome X and lower on autosomes (except for Chromosome 19) may be important for the functional differentiation and/ or maturation of Tpath. On the other hand, higher methylation density on autosomes (except for Chromosome 19) and lower on Chromosome X may be important for Tregs.
Comparative analyses of hypermethylation and hypomethylation peaks specific for Tpath or Tregs.
Other than analyses of the total methylation peaks, we further analyzed and compared the relative number and location of hypermethylation or hypomethylation peaks specifically detected in the Tpath or Tregs. Methylation peaks detected only in Tpath or both Tregs are defined as either Tpath-specific or Tregs-specific hypermethylation peaks. On the other hand, methylation peaks detected in the other cells but not in either Tpath or Tregs were defined as Tpath-specific or Tregs-specific hypomethylation peaks, respectively.
A total of 63 hypermethylation and 268 hypomethylation peaks were specifically identified in the Tpath. In comparison, 323 hypermethylation and 30 hypomethylation peaks were specifically identified in the Tregs (Figure 3). Further analyses showed that a vast majority (65%) of Tpath-specific hypermethylation peaks are located mainly in the promoter region, with only 24% in the intragenic region (Figure 3). However, less than 50% of Tregs-specific hypermethylation peaks are located in either the promoter (45%) or the intrageic region (31%). On the other hand, opposite to the hypermethylation peaks, most Tpath-specific hypomethylation peaks are located in either the promoter (36%) or the intragenic region (40%). Whereas, a majority (64%) of Tregs-specific hypomethylation peaks is located mainly in the intragenic region. These analyses also showed that, a significantly fewer Tpath-specific hypermethylation peaks (4%) than that of Tregs-specific hypermethylation peaks (21%) are located in the intergenic region (Figure 3). In contrast, more Tpath-specific hypomethylation peaks (20%) than that of Tregs-specific hypomethylation peaks (10%) are located in the intergenic region. Only a small percentage (3-7%) of cell-specific hypermethylation or hypomethylation peaks are located in the downstream region in these cells. We then analysed the Tpathspecific hypermethylation vs. Tpath-specific hypomethylation peaks on various chromosomes in the genome (Figure 3). Among the 63 identified Tpath-specific hypermethylation peaks,40 peaks (63.5%) are on Chromosome X. Unlike that of Tpath, nearly all of the 323 identified Tregs-specific hypermethylation peaks are on the autosomes. Only one methylation peak is detected on the Chromosome X (0.31%). However, a significantly greater percentage of Tregs-specific hypomethylation peaks (7 out of 30, or 23.3%) are on the Chromosome X, whereas fewer such peaks (23 of the 30, or 76.7%, with a range of 0-4/chromosome) are on autosomes.
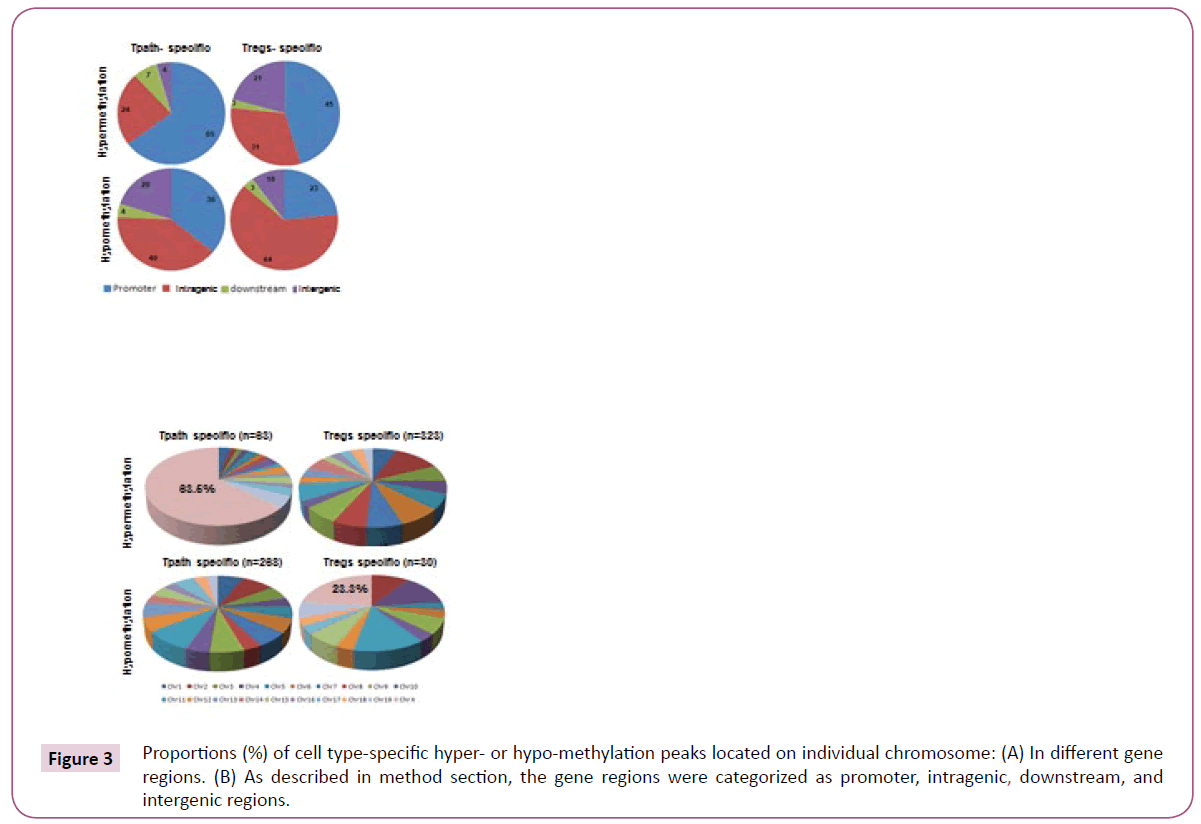
Figure 3: Proportions (%) of cell type-specific hyper- or hypo-methylation peaks located on individual chromosome: (A) In different gene regions. (B) As described in method section, the gene regions were categorized as promoter, intragenic, downstream, and intergenic regions.
Overall, these results may support the conclusion that the dramatic distinct methylation patterns of Chromosome X and autosomes in Tregs vs. Tpaths may play an important role in regulating functional differentiation and/or maturation of these T cells.
Discussion
In this study we performed DNA methylation microarray of one Tpath, two Tregs and one Tctrl in a genome-wide manner. One important discovery is that comparing to Tregs, Tpath shows relatively low methylation density on autosomes, while relatively high methylation density on chromosome X. The discovery can decompose to two aspects: 1) Global DNA methylation of Tpath is lower, especially on autosomes, than that of Tregs. 2) DNA methylation of Tpath on Chromosome X is higher than that of Tregs. The aberrance of DNA methylation in T cells has been linked to pathogenesis of many autoimmune diseases, including SLE [17,29-32], RA [30] and T1D [33]. Thereinto, DNA methylation changes in SLE have been well studied. Global DNA hypomethyation in CD4+ T cells has been detected in SLE. Hypomethylation of specific genes overexpressed in lupus T cells such as ITGAL (CD11a), CD40LG (CD40L), TNFSF7 (CD70), KIR2DL4, IFNGR2 and PRF1 (perforin) is believed to contribute to the development of autoreactivity and overstimulation of autoantibodies [34,35]. Many gene promoters are also found hypomethylated in other autoimmune disorders, such as MET in RA [36], PAD2 in MS [37], and p16, SHP1, p15, and p21 in psoriasis [38-40]. The overexpression of two methyl CpG –binding domain (MBD) proteins, MBD2 and MBD4, may assoiated with the DNA hypomethylation in SLE CD4+ T cells [41]. A genome-wide DNA methylation study with CD4+ T cells from SLE patients revealed 236 hypomethylated and 105 hypermethylated CG sites, and genes involved in autoimmunity, such as MMP9 and PDGFRA were found hypomethylated, while genes involved in DNA methylation were hypermethylated [42]. The DNA methylation studies on T1D are not as much. In a streptozotocin-induced T1D rat model, diabetes induced functional methyl deficiency which resulted in the hypomethylation of NDA in a tissue–specific fashion [43]. A genome-wide DNA methylation study on monocytes from T1D-discodant MZ twin pairs has identified 132 T1D-associated methylation variable positions (T1D-MVPs), which precede disease diagnosis [20]. In our study, we systemically compared the DNA methylations in four cell lines with different functions in NOD mice, a T1D animal model, and found lower methylation in Tpath and higher methylation in Tregs in global genome, and the difference was signified on individual autosomes, except chromosome 19. The difference of DNA methylation between Treg and Tpath may contribute the function difference between these two cells, while the detailed mechanisms need further investigation.
Acknowledgements
The authors thank Wen-Hui Lee for preparing the cell samples in the study and thank Dr. Xiwei Wu for the help with data analysis.
References
- Leslie RD, Delli Castelli M (2004) Age-dependent influences on the origins of autoimmune diabetes: evidence and implications. Diabetes 53: 3033-3040.
- Redondo MJ, Yu L, Hawa M, Mackenzie T, Pyke DA (2001) Heterogeneity of type I diabetes: analysis of monozygotic twins in Great Britain and the United States. Diabetologia 44: 354-362.
- Concannon P, Gogolin-Ewens KJ, Hinds DA, Wapelhorst B, Morrison VA, et al. (1998) A second-generation screen of the human genome for susceptibility to insulin-dependent diabetes mellitus. Nat Genet 19: 292-296.
- Davies JL, Kawaguchi Y, Bennett ST, Copeman JB, Cordell HJ, et al. (1994) A genome-wide search for human type 1 diabetes susceptibility genes. Nature 371: 130-136.
- Concannon P, Chen WM, Julier C, Morahan G, Akolkar B, et al. (2009) Genome-wide scan for linkage to type 1 diabetes in 2,496 multiplex families from the Type 1 Diabetes Genetics Consortium. Diabetes 58: 1018-1022.
- Noble JA, Valdes AM, Cook M, Klitz W, Thomson G, et al. (1996) The role of HLA class II genes in insulin-dependent diabetes mellitus: molecular analysis of 180 Caucasian, multiplex families. Am J Hum Genet 59: 1134-1148.
- Barrett JC, Clayton DG, Concannon P, Akolkar B, Cooper JD, et al. (2009) Genome-wide association study and meta-analysis find that over 40 loci affect risk of type 1 diabetes. Nat Genet 41: 703-707.
- Todd JA, Walker NM, Cooper JD, Smyth DJ, Downes K, P et al. (2007) Robust associations of four new chromosome regions from genome-wide analyses of type 1 diabetes. Nat Genet 39: 857-864.
- (2007) Genome-wide association study of 14,000 cases of seven common diseases and 3,000 shared controls. Nature 447: 661-678.
- Vehik K, Hamman RF, Lezotte D, Norris JM, Klingensmith GJ, et al. (2008) Trends in high-risk HLA susceptibility genes among Colorado youth with type 1 diabetes. Diabetes Care 31: 1392-1396.
- Fourlanos S, Varney MD, Tait BD, Morahan G, Honeyman MC, et al. (2008) The rising incidence of type 1 diabetes is accounted for by cases with lower-risk human leukocyte antigen genotypes. Diabetes Care 31: 1546-1549.
- Hewagama A, Richardson B (2009) The genetics and epigenetics of autoimmune diseases. J Autoimmun 33: 3-11.
- Dang MN, Buzzetti R, Pozzilli P et al. (2013) Epigenetics in autoimmune diseases with focus on type 1 diabetes. Diabetes Metab Res Rev 29: 8-18.
- Jayaraman S (2011) Epigenetics of autoimmune diabetes. Epigenomics 3: 639-648.
- Esteller M (2008) Epigenetics in cancer. N Engl J Med 358: 1148-1159.
- Miao F, Smith DD, Zhang L, Min A, Feng W, et al. (2008) Lymphocytes from patients with type 1 diabetes display a distinct profile of chromatin histone H3 lysine 9 dimethylation: an epigenetic study in diabetes. Diabetes 57: 3189-3198.
- Balada E, Ordi-Ros J, Vilardell-Tarres M (2007) DNA methylation and systemic lupus erythematosus. Ann N Y Acad Sci 1108: 127-136.
- Liu CC, Fang TJ, Ou TT, Wu CC, Li RN, et al. (2011) Global DNA methylation, DNMT1, and MBD2 in patients with rheumatoid arthritis. Immunol Lett 135: 96-99.
- Luo Y, Li Y, Su Y, Yin H, Hu N, et al. (2008) Abnormal DNA methylation in T cells from patients with subacute cutaneous lupus erythematosus. Br J Dermatol 159: 827-833.
- Rakyan VK, Beyan H, Down TA, Hawa MI, Maslau S, et al. (2011) Identification of type 1 diabetes-associated DNA methylation variable positions that precede disease diagnosis. PLoS Genet 7: e1002300.
- Sakaguchi S (2004) Naturally arising CD4+ regulatory t cells for immunologic self-tolerance and negative control of immune responses. Annu Rev Immunol 22: 531-562.
- Sakaguchi S, Fukuma K, Kuribayashi K, Masuda T (1985) Organ-specific autoimmune diseases induced in mice by elimination of T cell subset. I. Evidence for the active participation of T cells in natural self-tolerance; deficit of a T cell subset as a possible cause of autoimmune disease. J Exp Med 161: 72-87.
- Boitard C, Yasunami R, Dardenne M, Bach JF (1989) T cell-mediated inhibition of the transfer of autoimmune diabetes in NOD mice. J Exp Med 169: 1669-1680.
- Greiner DL, Mordes JP, Handler ES, Angelillo M, Nakamura N, et al. (1987) Depletion of RT6.1+ T lymphocytes induces diabetes in resistant biobreeding/Worcester (BB/W) rats. J Exp Med 166: 461-475.
- Haskins K, Cooke A (2011) CD4 T cells and their antigens in the pathogenesis of autoimmune diabetes. Curr Opin Immunol 23: 739-745.
- Bettini M, Vignali DA (2009) Regulatory T cells and inhibitory cytokines in autoimmunity. Curr Opin Immunol 21: 612-618.
- Piccirillo CA, Tritt M, Sgouroudis E, Albanese A, Pyzik M, et al. (2005) Control of type 1 autoimmune diabetes by naturally occurring CD4+CD25+ regulatory T lymphocytes in neonatal NOD mice. Ann N Y Acad Sci 1051: 72-87.
- Knip M, Siljander H (2008) Autoimmune mechanisms in type 1 diabetes. Autoimmun Rev 7: 550-557.
- Lei W, Luo Y, Yan K, Zhao S, Li Y, et al. (2009) Abnormal DNA methylation in CD4+ T cells from patients with systemic lupus erythematosus, systemic sclerosis, and dermatomyositis. Scand J Rheumatol 38: 369-374.
- Richardson B, Scheinbart L, Strahler J, Gross L, Hanash S, et al. (1990) Evidence for impaired T cell DNA methylation in systemic lupus erythematosus and rheumatoid arthritis. Arthritis Rheum 33: 1665-1673.
- Renaudineau Y, Youinou P (2011) Epigenetics and autoimmunity, with special emphasis on methylation. Keio J Med 60: 10-16.
- Zhou Y, Lu Q (2008) DNA methylation in T cells from idiopathic lupus and drug-induced lupus patients. Autoimmun Rev 7: 376-383.
- Fradin D, Le Fur S, Mille C, Naoui N, Groves C, et al. (2012) Association of the CpG methylation pattern of the proximal insulin gene promoter with type 1 diabetes. PLoS One 7: e36278.
- Sawalha AH, Jeffries M (2007) Defective DNA methylation and CD70 overexpression in CD4+ T cells in MRL/lpr lupus-prone mice. Eur J Immunol 37: 1407-1413.
- Jeffries MA, Sawalha AH (2011) Epigenetics in systemic lupus erythematosus: leading the way for specific therapeutic agents. Int J Clin Rheumtol 6: 423-439.
- Neidhart M, Rethage J, Kuchen S, Kunzler P, Crowl RM, et al. (2000) Retrotransposable L1 elements expressed in rheumatoid arthritis synovial tissue: association with genomic DNA hypomethylation and influence on gene expression. Arthritis Rheum 43: 2634-2647.
- Mastronardi FG, Noor A, Wood DD, Paton T, Moscarello MA (2007) Peptidyl argininedeiminase 2 CpG island in multiple sclerosis white matter is hypomethylated. J Neurosci Res 85: 2006-2016.
- Chen M, Chen ZQ, Cui PG, Yao X, Li YM, et al. (2008) The methylation pattern of p16INK4a gene promoter in psoriatic epidermis and its clinical significance. Br J Dermatol 158: 987-993.
- Ruchusatsawat K, Wongpiyabovorn J, Shuangshoti S, Hirankarn N, Mutirangura A (2006) SHP-1 promoter 2 methylation in normal epithelial tissues and demethylation in psoriasis. J Mol Med (Berl) 84: 175-182.
- Zhang K, Zhang R, Li X, Yin G, Niu X (2009) Promoter methylation status of p15 and p21 genes in HPP-CFCs of bone marrow of patients with psoriasis. Eur J Dermatol 19: 141-146.
- Balada E, Ordi-Ros J, Serrano-Acedo S, Martinez-Lostao L, Vilardell-Tarres M (2007) Transcript overexpression of the MBD2 and MBD4 genes in CD4+ T cells from systemic lupus erythematosus patients. J Leukoc Biol 81: 1609-1616.
- Jeffries MA, Dozmorov M, Tang Y, Merrill JT, Wren JD, (2011) Genome-wide DNA methylation patterns in CD4+ T cells from patients with systemic lupus erythematosus. Epigenetics 6: 593-601.
- Williams KT, Garrow TA, Schalinske KL (2008) Type I diabetes leads to tissue-specific DNA hypomethylation in male rats. J Nutr 138: 2064-2069.
- Sun D, Yu Q, Li P, Shen J (2016) Genomewide analyses of pathogenic and regulatory T cells of NOD mice reveal a significant difference in DNA methylation on chromosome X. J Genet 95: 1023-1029.
- Haskins K, Portas M, Bradley B, Wegmann D, Lafferty K (1988) T-lymphocyte clone specific for pancreatic islet antigen. Diabetes 37: 1444-1448.
- You S, Chen C, Lee WH, Wu CH, Judkowski V, et al. (2003) Detection and characterization of T cells specific for BDC2.5 T cell-stimulating peptides. J Immunol 170: 4011-4020.
- Chen C, Lee WH, Yun P, Snow P, Liu CP (2003) Induction of autoantigen-specific Th2 and Tr1 regulatory T cells and modulation of autoimmune diabetes. J Immunol 171: 733-744.
- Chen C, Lee WH, Zhong L, Liu CP (2006) Regulatory T cells can mediate their function through the stimulation of APCs to produce immunosuppressive nitric oxide. J Immunol 176: 3449-3460.