Keywords
Forex trading data; Forex data experiments; Forex data analysis; Forex
data visualization
Introduction
When planning a forex trading system, a trader needs to carefully
design the system and extensively test it. Besides the help of
some technical indicators and fundamental analysis [1,2], a
trading system needs to set many risk management parameters,
such as stop loss and take profit [3]. These parameters play an
important rule to determine the trader’s target profit and also
limit the loss risk of each open trade.
To investigate the ideal level for risk management parameters
and the trading system, this research tries to find the answer
to those questions. Some experiments are conducted in the H1
timeframe, which updates the price hourly. Two main currency
pairs with different time ranges are used in this paper: EUR/USD
(1 year) and USD/JPY (20 years). The experiments use the dataset
from Kaggle, a website that provides many kinds of datasets for
machine learning and data scientists [4]. Some data visualization
techniques are used to represent the result of these data using
Weka. Weka is open source software that provides many machine
learning techniques and data visualization tools [5].
Methodology and Analysis
Forex trading
Forex (foreign exchange) is a global marketplace where the
banks, corporations, investors, and individual traders exchange
foreign currencies for a variety of reasons. The fluctuations
of these currencies are the target for traders for making some profit. But at the same time, a trader risks their account when
the market moves against his open position. The currencies are
traded in pairs. The four major currency pairs are EUR/USD, USD/
JPY, GBP/USD, and USD/CHF. Figure 1 shows the approximate
volume breakdown per currency pair [6].
The forex market works 24 hours a day, 5 days a week. Table 1 shows the opening and closing times [6].
| Time zone |
New York |
GMT |
| Tokyo Open |
7:00 p.m. |
00:00 |
| Tokyo Close |
4:00 a.m. |
09:00 |
| London Open |
3:00 a.m. |
08:00 |
| London Close |
12:00 p.m. |
17:00 |
| New York Open |
8:00 a.m. |
13:00 |
| New York Close |
5:00 p.m. |
22:00 |
Table 1: Global Trading hour schedule.
Figure 1: Estimated trading volume by currency pair.
Forex risk management
When a trader opens a position in the forex market, two actions
can be taken: buy or sell. If the trader thinks that the price will go
upward, he is supposed to open a buy position. On the contrary,
if the trader considers that the price will go downward, he is
supposed to open a sell position. After a trader chooses one
of that action, but unluckily the market moves against its open
position, the trader will lose. In this case, he has to protect his
account by limiting the loss he’s suffered. There are many types of
risk management strategies [3]. Some parameters that can be set
to limit the loss of any open trade are stop loss and target profit.
In this paper, some experiments are conducted to investigate the
ideal level to set these parameters.
Data preparation and mining
This research uses past forex data that is gained from Kaggle, a
website that provides many kinds of datasets for machine learning
and data scientists [4]. We choose the H1 timeframe of the two
top biggest volume currencies traded in the global market: EUR/
USD & USD/JPY [6]. This raw data is then cleaned, transformed,
and represented in some visualization charts by using Weka.
Weka is an open-source data mining and visualization framework.
Weka was developed at the University of Waikato, New Zealand. Figure 2 shows the user interface of Weka. This paper uses Weka
as a tool for data visualization and mining.
Figure 2: Weka interface.
Experiment Setup and Result
Experiments are conducted to the top two biggest volume traded
currency pairs: EUR/USD and USD/JPY. The H1 timeframe for
1 year is used for all the experiments. As mention before, the
datasets that are used in these experiments are from Kaggle.
com [3], a website that provides many kinds of datasets for
machine learning and data science purposes. These datasets use
pip (price in percentage), which is the smallest value by which a
currency may fluctuate in the forex market [5]. The goals of these
experiments are explained in the following sections.
Experiment with information gain
The goal of this experiment is to sort the most important
attributes to the price change above 10 pips. Table 2 shows the
experimental result.
| No. |
Attribute |
Information gain |
| 1 |
Date |
0.1438 |
| 2 |
Volume |
0.125 |
| 3 |
Low |
0.0661 |
| 4 |
Close |
0.0661 |
| 5 |
High |
0.0657 |
| 6 |
Open |
0.0656 |
| 7 |
Hour |
0.0599 |
Table 2: Information gain experiment.
Two top attributes are date and volume. This shows that in some
certain times, the forex market is trending (the price change
above 10 pips) and the number of volumes influences this trend.
Experiment with 10 pips of currency fluctuation
Based on the first experiment, the dataset is categorized based
on the pip change that shows whether the market is on the
condition of trending or sideways. So in this experiment, a new
attribute, Class 10 Pip Change, was added based on the open
price of the next candle minus the close price of the previous
candle. This attribute has three possibilities of value:
• -10pips: the price decrease above 10 pips
• ranging: the price change below 10 pips
• +10pips: the price increase above 10 pips
Table 3 and Figure 3 show the result of this experiment.
| No. |
Attribute value for class 10 pip change |
Number of records |
| 1 |
-10pips |
955 |
| 2 |
ranging |
4722 |
| 3 |
+10pips |
841 |
| Total |
6518 |
Table 3: Experiment with class 10 pips change.
Figure 3: Experiment with class 10 pips change.
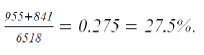
From the data distribution, it can be concluded that most of
the time EUR/USD is fluctuated below 10 pips, which shows the
condition of sideways or ranging. From 6,518 different records,
4,722 records of it (72%) is the change below 10 pips. This data
can be used to determine the algorithm of how to trade the forex
currency pair. The algorithm must be dealt with ranging market.
From this experiment, the trader can decide how many percent
of winning chance if he set the forex parameters such as stop loss
or target profit level at a certain position.The chance of uptrend
or downtrend can be calculated as
Experiment with 25 pips of currency fluctuation
Similar with the previous experiment, the dataset is categorized based on the 25 pip change that shows whether the market is on
the condition of trending or sideways. So in this experiment, a
new attribute, Class 25 Pip Change, was added based on the open
price of the next candle minus the close price of the previous
candle. This attribute has three possibilities of value:
• -25pips: the price decrease above 25 pips
• ranging: the price change below 25 pips
• +25pips: the price increase above 25 pips
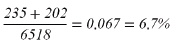
Table 4 and Figure 4 show the result of this experiment. From
the data distribution, it can be concluded that most of the time
EUR/USD fluctuates below 25 pips, which shows the condition of
sideways or ranging. From 6,518 different records, 6,081 records
of it (93%) is the change below 25 pips. This data can be used
to determine the algorithm of how to trade the forex currency
pair. The algorithm must be dealt with the ranging market. From
this experiment, the trader can decide how many percent of
winning chance if he set the forex parameters such as stop loss or
target profit level at a certain position. The chance of uptrend or
downtrend can be calculated as
| No. |
Attribute value for class 25 pip change |
Number of records |
| 1 |
-25pips |
235 |
| 2 |
ranging |
6081 |
| 3 |
+25pips |
202 |
| Total |
6518 |
Table 4: Experiment with class 25 pips change.
Figure 4: Experiment with class 25 pips change.
Experiment comparison of uptrend to downtrend EUR/USD
The goal of this experiment is to know the comparison of the up
prices to the down prices in EUR/USD pairs. A new attribute Class
Price Up was added in this experiment, with two possibilities of
value: TRUE or FALSE. TRUE means the next close price is higher
than the previous close price. FALSE means the contrary.
Table 5 and Figure 5 show the result of this experiment.
| No. |
Attribute value for class price up |
Number of records |
| 1 |
FALSE |
3362 |
| 2 |
TRUE |
3156 |
| Total |
6518 |
Table 5: Experiment with class 25 pips change.
This experiment shows that the number of up prices more or less
equals the number of down prices. From this experiment, the
trader has a 50:50 percent chance to buy or sell decisions.
Figure 5: Experiment with class price up.
Experiment time of EUR/USD trending market
The goal of this experiment is to know the tendency of the time
when the EUR/USD is trending during a day. The price of each
transaction to the time of a day is plotted in the chart below
(Figure 6).
Figure 6: Market price to the time chart.
The X-axis shows the time of the days and the Y-axis shows the
attribute value of Class 25 Pips Change: -25pips, ranging, or
+25pips. The red dots show the ranging market that happens
most of the time of any day. The green dots represent the up
trending market that moves above 25 pips. From the chart, it
can be seen that most of the trending market happened during
office hours (7a.m. to 5 p.m.). Outside that time, the trend rarely
happened.
From this experiment, if the trader’s used the trending algorithm,
it would be better to apply it during office hours. On the other
hand, if the trader uses an algorithm that can be dealt with
ranging markets, it can be applied most of the time of the day.
The trader can set the forex parameters, such as stop loss and
take profit below 25 pips to gain more profit or reduce the risks.
Figure 7 shows the pip change range to time in the EUR/USD forex
market. From this figure, it can be seen that the most trending
market happened at about 14:00-15.00. If some of this data is
selected (Figure 8), it can be seen that when the market starts
to open, the possibility of the downtrend is more often than the
uptrend.
Figure 7: EUR/USD fluctuation range (in pips).
Figure 8: The Possibility of the downtrend when the market starts to open.
Experiment time of EUR/USD trending market
The goal of this experiment is to know the characteristics of
another major currency pair in forex: USD/JPY. In this experiment,
we used a large dataset (H1 timeframe, for 20 years from 1999 to
2019) that consists of 128,800 records of transactions. This data
is categorized into groups of attribute Class 10 Pip Change:
• -10pips: the price decrease above 10 pips
• ranging: the price change below 10 pips
• +10pips: the price increase above 10 pips
Table 6 and Figure 9 show the result of this experiment. From the
data distribution, 69.6% of all the transactions fluctuated below
10 pips, which shows the condition of sideways or ranging. While
the other 15.3% and 15.1% each is the up and down trend (more
than 10 pip change). This shows that the opportunity to buy and
sale is comparable for each new open position.
| No. |
Attribute value for class 10 pip change |
Number of records |
| 1 |
-10pips |
19, 494 |
| 2 |
ranging |
89, 618 |
| 3 |
+10pips |
19, 688 |
| Total |
128, 800 |
Table 6: Experiment with class 10 pips change.
Figure 9: Experiment with class 10 pips change in USD/JPY.
Experiment with 25 Pips of currency fluctuation
Similar to the previous experiment, the dataset is categorized
based on the 25 pip change that shows whether the market is
on the condition of trending or sideways. So in this experiment, a
new attribute, Class 25 Pip Change, was added based on the open
price of the next candle minus the close price of the previous
candle. This attribute has three possibilities of value:
• -25pips: the price decrease above 25 pips
• ranging: the price change below 25 pips
• +25pips: the price increase above 25 pips
Table 7 and Figure 10 show the result of this experiment. From
the data distribution, it can be seen that 93.8% of all the USD/
JPY transaction records fluctuated below 25 pips, which shows
the condition of sideways or ranging. This data can be used to
determine the forex risk management parameter such as stop
loss and take profit. If they are set above 25 pips, the winning
possibility is below 6.1%. It also can be concluded that if the
trader uses an algorithm or strategy that can work when the
market is ranging/ sideways, the profit gain will be more bigger
than an algorithm that only works in a trending market. This is
because 93.8% of all the last 20 years transactions are ranging
below 25 pips.
| No. |
Attribute value for class 25 pip change |
Number of records |
| 1 |
-25pips |
4,125 |
| 2 |
ranging |
120,865 |
| 3 |
+25pips |
3,810 |
| Total |
128,800 |
Table 7: Experiment with class 25 pips change.
Figure 10: Experiment with class 25 pips change in USD/JPY.
Experiment with USD/JPY trending time
The goal of this experiment is to know the best time to trend USD/
JPY if a trader uses an algorithm that counts on-trend. Figure 11 shows the transactions plotted against time. The red dots show
the upward trend above 25 pips. The green dots show downward
trends of more than 25 pips. The blue dots represent the ranging
market. The trend not only happened during the office hours (7
a.m-5 p.m.) but also during midnights (11 p.m-3 a.m.).
Figure 11: Experiment with class 25 pips change in USD/JPY.
If we decrease the threshold to 10 pips, the chart will look like Figure 12. This data can be used to determine the level of stop
loss and take profit. Most of the time, the market fluctuates
between 10 pips to +10 pips.
Figure 12: Price movement (in pip) plotted to time.
Figure 13 shows the pip change plotted to the time of a day.
From this plot, it can be seen that most of the trending market
happened at about 1 p.m. to 4 p.m. If we ignore the outliers of Figure 13 (Figure 14), we get the chart that is shown in Figure
15. The red dots show the upward trend above 25 pips, while the
green dots show the downward trend.
Figure 13: Price Movement (in pip) plotted to time (USD/JPY).
Figure 14: Choose only the gray area of this data.
Figure 15: The data without the outliers.
Figure 16 shows the uptrend fluctuation range and Figure 17 shows the downtrend fluctuation range (both in pip).
Figure 16: Range of the uptrend of USD/JPY pair (in pip).
Figure 17: Range of the downtrend of USD/JPY pair (in pip).
Conclusion
From the experiments, it can be concluded that most of the time,
the forex market is ranging below 10 pips. This can be used to
determine how a trading algorithm works. A forex trading robot
that can deal with ranging markets is preferable than the one
which only waits for the trending market. Most of the market
trends happened during office hours (7 a.m. to 5 p.m.) for EUR/
USD, but almost all the time for USD/JPY. The possibilities of
winning between buy and sell actions are comparable for both of
the major currencies pairs.
Acknowledgements
The authors would like to thank LPPM Parahyangan Catholic
University for the research grant and the Department of
Informatics Parahyangan Catholic University which supports the
research.
References
- Abednego L, Nugraheni CE (2015) Development of Forex Robot in Meta Trader 4. Prosiding International Congress on Engineering and Information, 2015.
- Abednego L, Nugraheni CE, Rinaldy I (2018) Forex trading robot with technical and fundamental analysis. J Comput 13: 1089-1097.
- Abednego L, Nugraheni CE (2018) Development of Forex Trading Robot with Money Management. Makalah dipresentasikan pada Asia Pacific Conference on Engineering and Applied Sciences-Higher Education, Sydney, Australia, 2018.
- Jimenez DF (2020) Forex currencies M1, M5, M15, M30, H1, H4, D1. Notebooks-www. Kaggle. com, 2020.
- Witten IH, Frank E, Hall M, Pal CJ (2016) Data Mining Practical Machine Learning Tools and Techniques. Morgan Kaufmann. Fourth Edition, 2016.
- Norris J, Bell T, Gaskill AI (2010) Mastering the Currency Market: Forex Strategies for High- and Low-Volatility Markets. McGraw-Hill Education, 2010.