 |
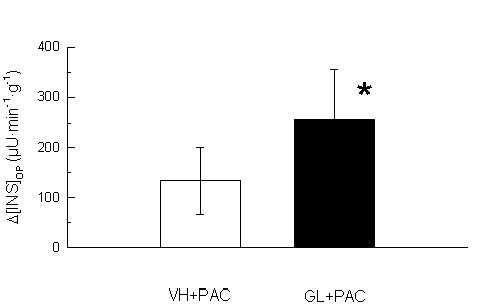
| Figure 5. Net increase in insulin output (Δ[INS]OP) in response to PACAP1-27 (0.05 μg) in the group receiving the vehicle and PACAP1-27 (VH+PAC) in the first bloc and glucose (5%) and PACAP1-27 (GL+PAC) in the second bloc. Open columns indicate the data obtained without glucose infusion, and the filled column represents the data with combined administration of glucose with PACAP1-27. * P=0.033 (n=7). |