|
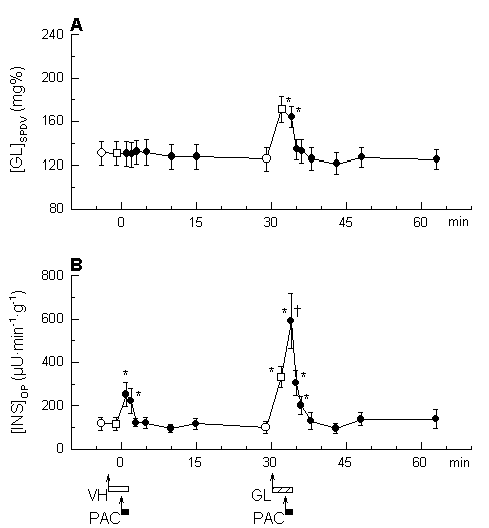
| Figure 4. Effect of PACAP1-27 infused into the superior pancreaticoduodenal (SPD) artery in the absence (first bloc) and the presence of glucose infusion (second bloc) on A) plasma glucose concentration in SPD venous blood ([GL]SPDV) and B) insulin output ([INS]OP). Arrows indicate the onset of administration either of the vehicle (VH, saline), glucose (GL, with 5% solution) or PACAP1-27 (PAC, 0.05 μg). Horizontal bars attached to the arrows indicate the infusion period of vehicle (an open bar), glucose (a bar filled with upright diagonal lines) and PACAP1-27 (filled bars). Open circles represent control values observed immediately before the administration of the vehicle or glucose, and open squares indicate those before the administration of PACAP1-27. * P≤0.038 vs. corresponding controls taken before the administration of the vehicle or glucose (n=7). † P=0.002 vs. the peak insulin response to PACAP1-27 administered at minute 0 (n=7). |