 |
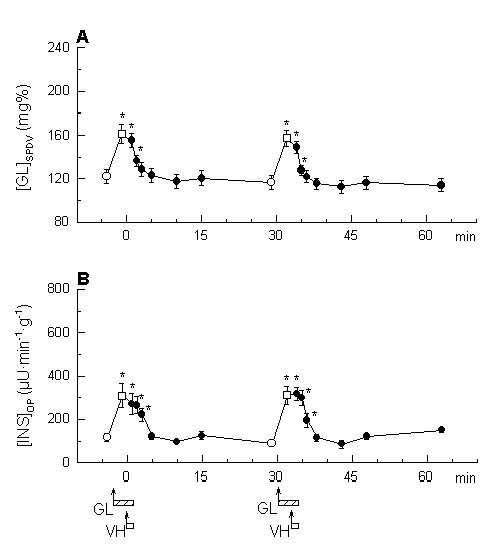
| Figure 2. Effect of glucose infused with the isotonic solution (5%) into the superior pancreaticoduodenal (SPD) artery on A) plasma glucose concentration in SPD venous blood ([GL]SPDV) and B) insulin output ([INS]OP). Arrows indicate the onset of administration of either glucose (GL) or the vehicle (VH, saline). Horizontal bars attached to the arrows indicate the infusion period of glucose (bars filled with up-right diagonal lines) and vehicle (open bars). Open circles represent control values observed immediately before the administration of glucose, and open squares indicate those before the administration of the vehicle. * P≤0.016 vs. corresponding controls taken before the administration of glucose (n=7). |