|
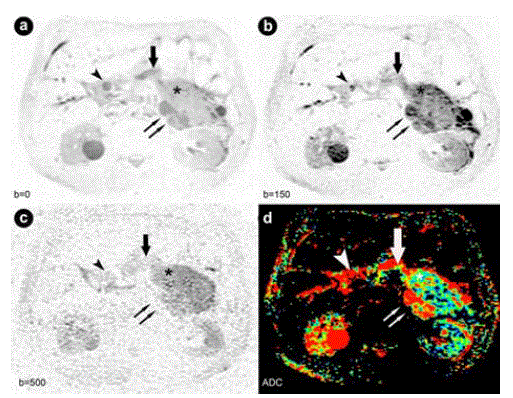
| Figure 3. Diffusion weighted images at b=0, 150 and 500 s/mm2 and apparent diffusion coefficient-mapping generated from b-values at b=150 s/mm2. a. b. c. Axial diffusion-weighted images displayed with an inverted grey-scale at the level of the pancreatic tail acquired at b=0, 150 and 500 s/mm2. The diffusion-weighted imaging sequences allowed the visualization of the solid tumor parts (asterisk), the pancreatic duct (arrow), the distal common bile duct (arrowhead) as well as the cystic parts in the pancreatic tail (double arrow) with different intensity. Signal intensities of all the cystic tumor parts were highest on diffusion-weighted imaging with bvalues at 0 and 150 s/mm2; with a higher b-value of 500 s/mm2, signal intensities of the cysts decreased significantly indicating a T2 shine through effect. d. Apparent diffusion coefficient-maps confirmed the T2 shine-through effect for all cystic lesions (colored red; double arrow) but not for the solid tumor parts within the cystic components and the pancreatic duct (colored blue; asterisk and arrow). Intraductal oncocytic papillary neoplasm in the common bile duct, confirmed pathologically, was not identifiable on apparent diffusion coefficient-mapping (arrowhead). |