 |
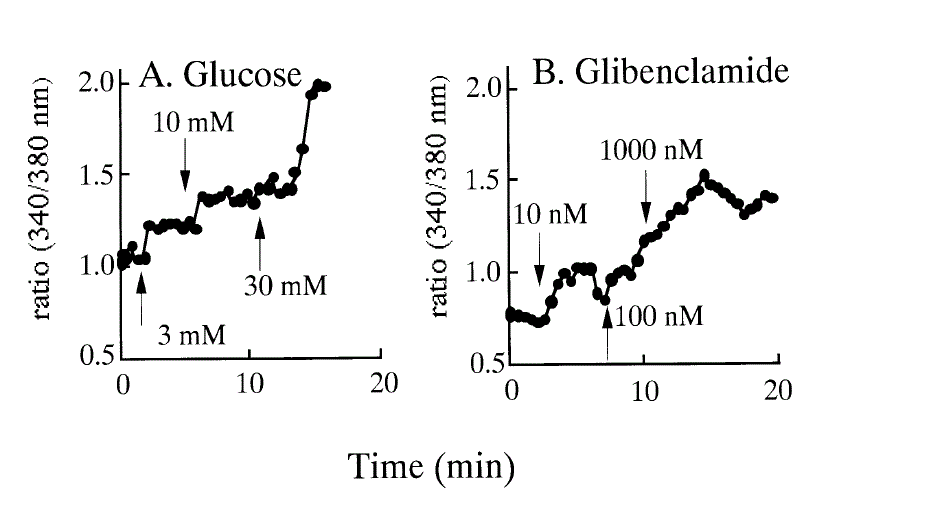
| Figure 1: The effects of glucose and glibenclamide on cytosolic Ca2+ in HIT cells. A. Glucose (3, 10, 30 mmol/L) and B. Glibenclamide (10, 100, 1,000 nmol/L) were perfused. The results are presented as the 340/380 nm wavelength ratio of fluorescence. |