 |
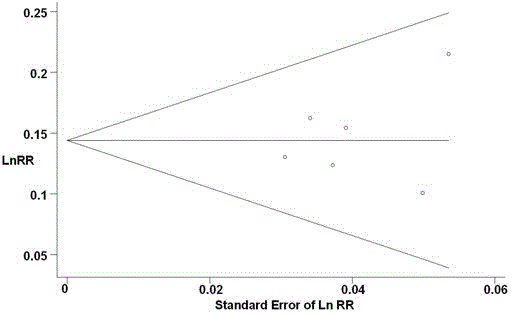
| Figure 4. Begg's funnel plot with pseudo 95% confidence limits. Funnel plot shows the relative risks (for 12 g/day) on a natural logarithm scale on its standard error for the six studies included in the meta-analysis. The horizontal line represents the summary estimate of relative risks and the diagonal lines indicate the expected 95% confidence intervals for a given standard error. |