 |
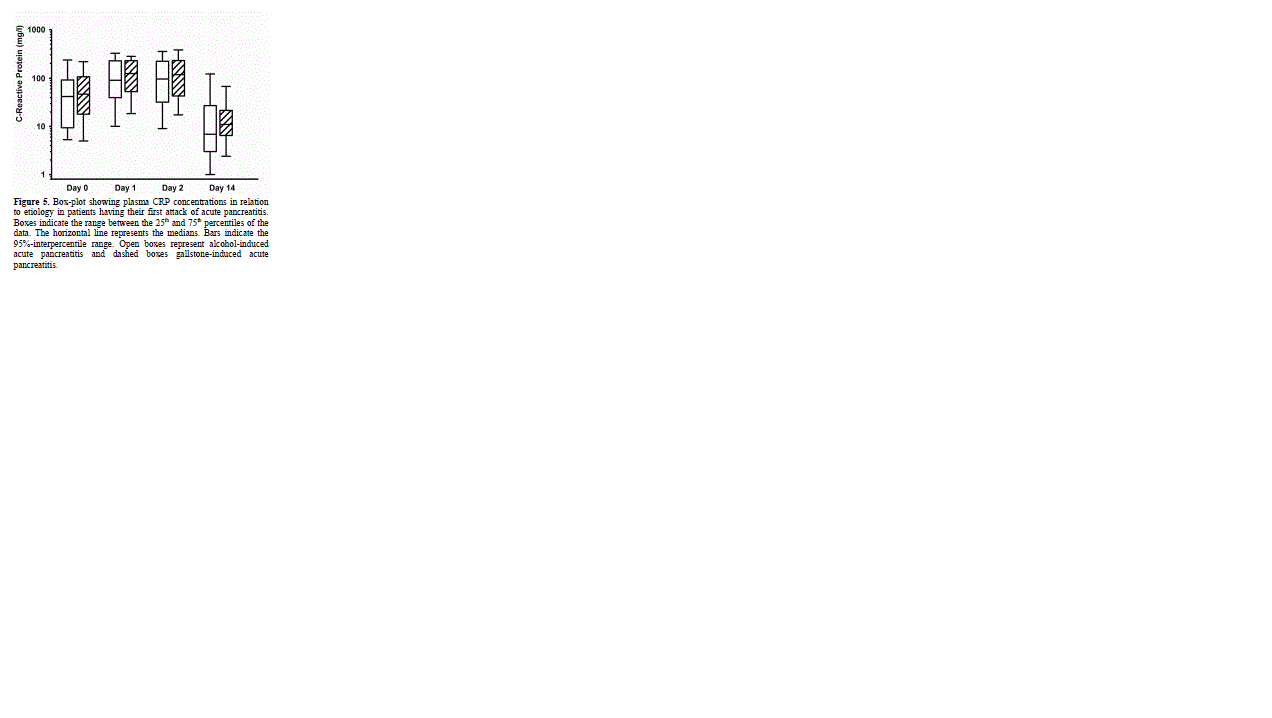
| Figure 5. Box-plot showing plasma CRP concentrations in relation to etiology in patients having their first attack of acute pancreatitis. Boxes indicate the range between the 25th and 75th percentiles of the data. The horizontal line represents the medians. Bars indicate the 95%-interpercentile range. Open boxes represent alcohol-induced acute pancreatitis and dashed boxes gallstone-induced acute pancreatitis. |