 |
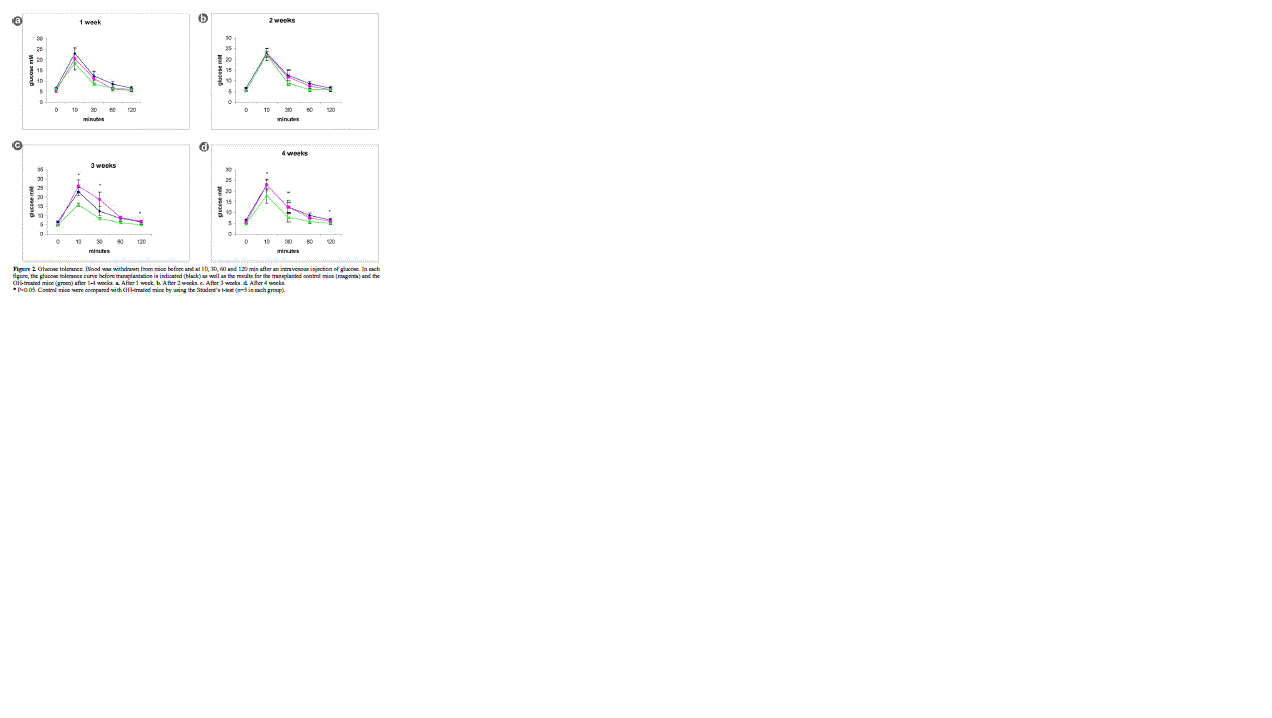
| Figure 2. Glucose tolerance. Blood was withdrawn from mice before and at 10, 30, 60 and 120 min after an intravenous injection of glucose. In each figure, the glucose tolerance curve before transplantation is indicated (black) as well as the results for the transplanted control mice (magenta) and the GH-treated mice (green) after 1-4 weeks. a. After 1 week. b. After 2 weeks. c. After 3 weeks. d. After 4 weeks. * P< 0.05. Control mice were compared with GH-treated mice by using the Student’s t-test (n=5 in each group). |