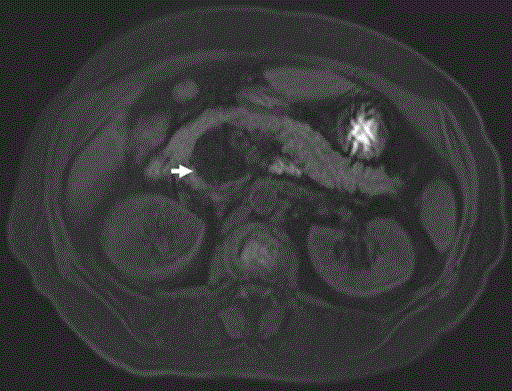
Figure 2.
The fat-suppressed T2-weighted image shows a loss in signal intensity of pancreatic mass (arrow).