 |
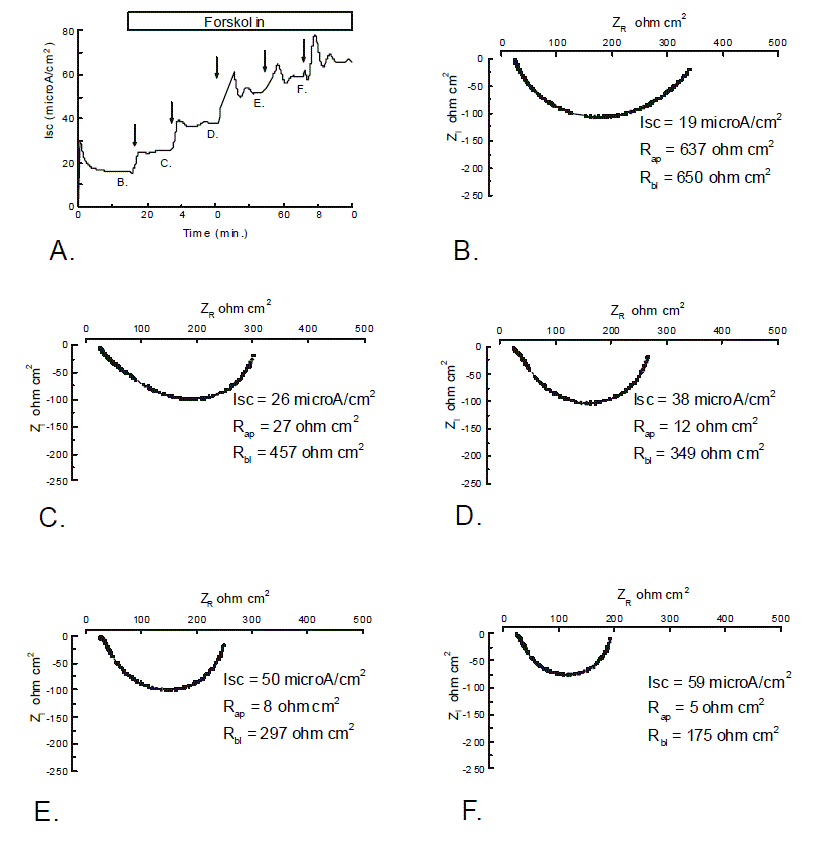
| Figure 6. Short circuit current trace and Nyquist plots at different concentrations of forskolin. A forskolin dose response was performed to obtain different levels of ISC and impedance spectra were obtained at each new steady state. Impedance data were fit to the equations that describe the equivalent electric circuit shown in Figure 4. Note the vanishingly small portion of the impedance that can be attributed to the apical membrane as the ISC increased. |