 |
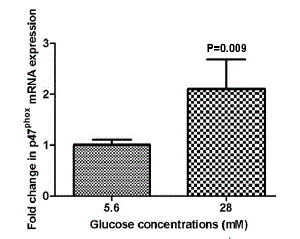
| Figure 4. Real-time RT-PCR analysis of p47phox mRNA expression in INS-1E beta-cells incubated in 5.6 mM and 28 mM glucose. The relative expression was normalized as a percentage of beta-actin mRNA using the comparative threshold cycle 2-ΔΔCT method. All data are expressed as mean±SE; n=4 per group; P value vs. 5.6 mM glucose: ANOVA. |