 |
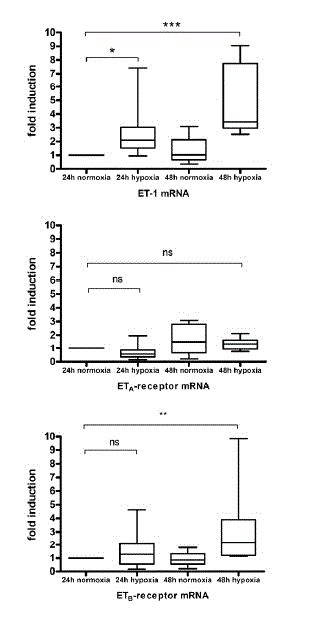
| Figure 8. Quantitative RT-PCR analysis of ET-1, ETA-, or ETB-receptor mRNA levels in human islets incubated for 24 h and 48 h at normoxic (21% O2) or hypoxic (1% O2) conditions. Results are box (interquartile range; median value is shown within the box) and whisker (minimal and maximal values) plots from 11 human islet isolations. No variability can be computed for the 24 h normoxic reference point (calibrator) due to the delta-delta ct real-time analysis method of always setting the calibrator to a value of 1. P values resulted from the comparison of 24 and 48 h hypoxia vs. 24 h normoxic conditions Number of observations: 24 h normoxia (n=11); 24 h hypoxia (n=11); 48 h normoxia (n=8); 48 h hypoxia (n=8) *P< 0.05; **P< 0.01, ***P< 0.001 |