 |
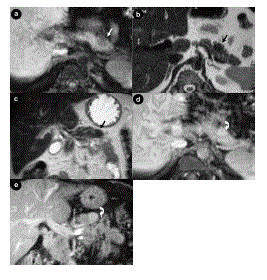
| Figure 1. The lesion is seen as an area of low signal intensity on axial fat-saturated T1-weighted fast field echo (FFE) images (TR/TE/FA/NEX: 169/4.6/80/1) (a. arrow) as well as axial (b.) and coronal (c.) T2- weighted single shot turbo spin echo (SS-TSE) MR images (TR/TE/NEX/TSE factor: 700/80/1/72) (arrows). Axial (d.) and coronal (e.) fat-saturated delayed phase T1-weighted FFE images demonstrate the same lesion as a high signal area (arrow) as compared to the surrounding pancreatic parenchyma. |