 |
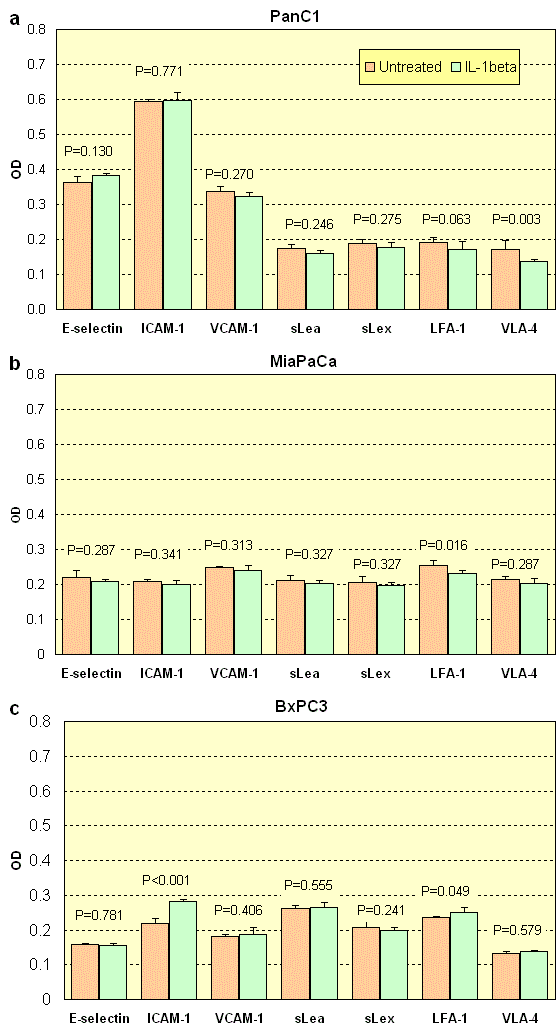
| Figure 4. Adhesion molecule expression on PanC1, MiaPaCa and BxPC3 obtained with EIA. Orange bars represent basal expression; green bars represent expression after 12 hours pre-incubation with 10 ng/mL IL-1beta. Bars represent the mean±SD absorbance values (OD 405 nm). Generally, n=4 wells were evaluated for each experiment. (Two-way ANOVA; the effect of the pre-incubation with IL-1beta was evaluated within the various categories using a nested design). |