 |
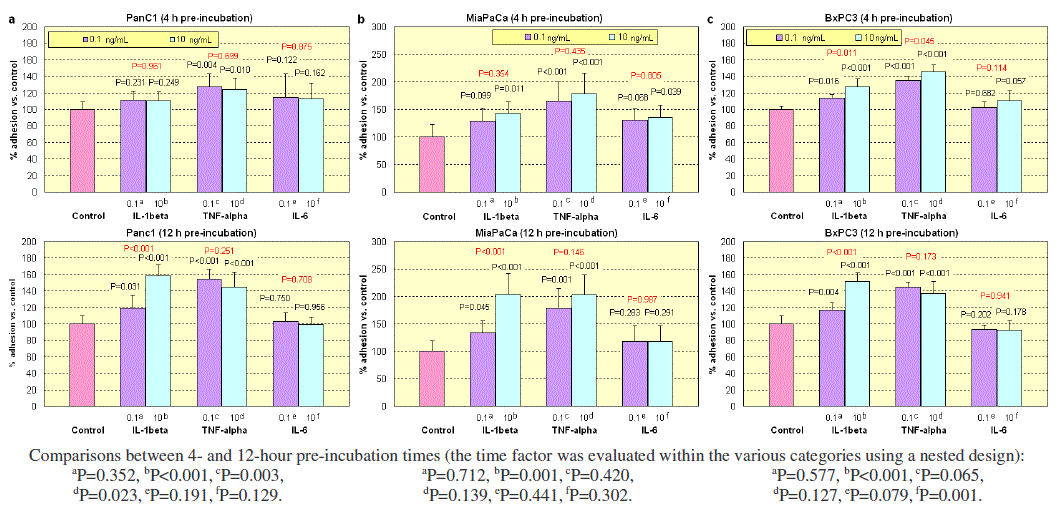
| Figure 1. Adhesion of PanC1, MiaPaCa and BxPC3 to MECs after 4 and 12 hours of pre-incubation of MECs with 0.1 or 10 ng/mL IL-1beta, TNF-alpha or IL-6. Mean±SD values are shown. Generally, n=6 samples were evaluated for each experiment. (Two-way ANOVA). Black P values refer to the comparison with the control group (untreated MECs): simple contrast was applied within the two time evaluations by a nested design. Red P values refer to the comparison between 0.1 and 10 ng/mL; repeated contrast was applied within the two time evaluations using a nested design. |