 |
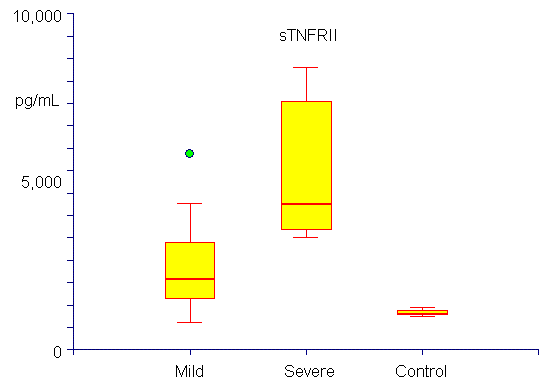
| Figure 9. Box-and-whisker plot of sTNFRII concentration showing the distribution of patients according to disease severity compared with healthy controls. sTNFRII concentration was elevated in acute pancreatitis (mild and severe pooled together) compared to healthy controls (P=0.002). The concentration was greater in those with severe compared to mild acute pancreatitis although this did not reach statistical significance (P=0.059). Boxes represent the interquartile range (IQR: i.e., the middle 50% between the 2nd and 3rd quartiles); whiskers represent the minimum and the maximum value in the absence of outliers or extreme values. We have computed one outlier (green bullet) in the mild acute pancreatitis group. (Outliers were defined as values between 1.5 IQRs and 3 IQRs from the end of a box). |