 |
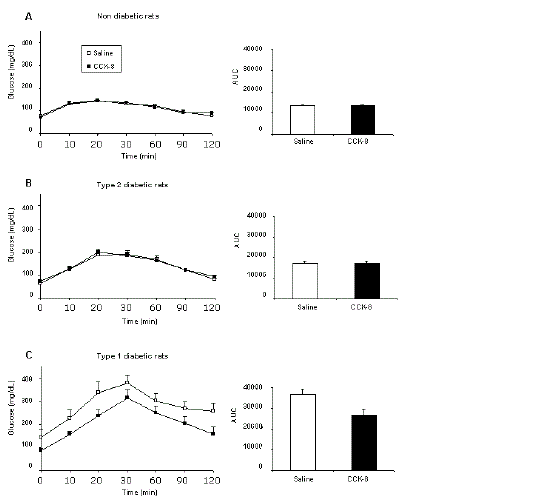
| Figure 3.Blood glucose concentrations during OGTT in non-diabetic rats (A), type 2 diabetic rats (B) and type 1 diabetic rats (C) treated with saline (open squares) or CCK-8 (1 μg/kg for non-diabetic and type 2 diabetic rats or 4 μg/kg for type 1 diabetic rats) (black squares). Insets: AUC for the glycemic responses (mg/dL x min over a 120-min test) in saline (controls, white columns) and CCK-8 treated rats (black columns). Glucose was administered at a dosage of 2 g/kg. Data are mean±SEM of 7 animals. |