 |
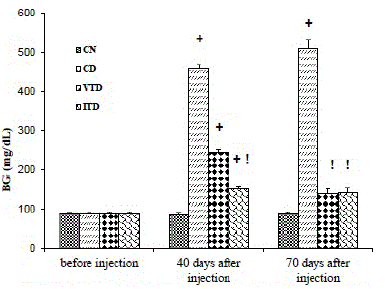
| Figure 1. The level of blood glucose in the control normal(CN), control diabetic (CD), vanadium-treated(VTD) and insulintreated (ITD) diabetic groups. Data expressed as mean ± SEM. +Significantly different from CN and their own pretreated conditions CN (p< 0.0001). !Significantly different from CD (p< 0.01). |