 |
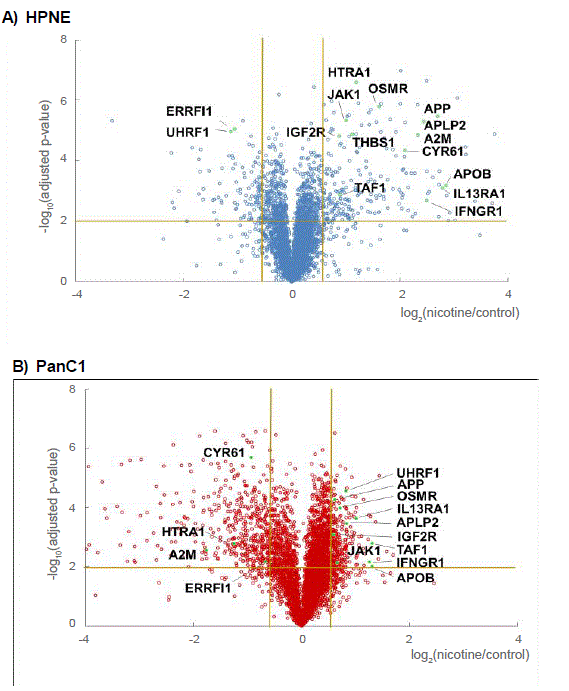
| Figure 3: Volcano plots of quantified, differentially expressed proteins, highlighting select proteins that are statistically significant in both cell lines. These volcano plots illustrate the log10 Benjamini-Hochberg corrected p-value (log10 (adjusted p-value)) vs. the log2 change of protein abundance in the presence (+) and absence (-) of nicotine (log2 (+/- nicotine)) for A) HPNE and B) PanC1 cell lines. The significance thresholds are represented by a horizontal line (p-value = 0.01) and two vertical lines (-1.5 fold on the left and +1.5 fold on the right). |