 |
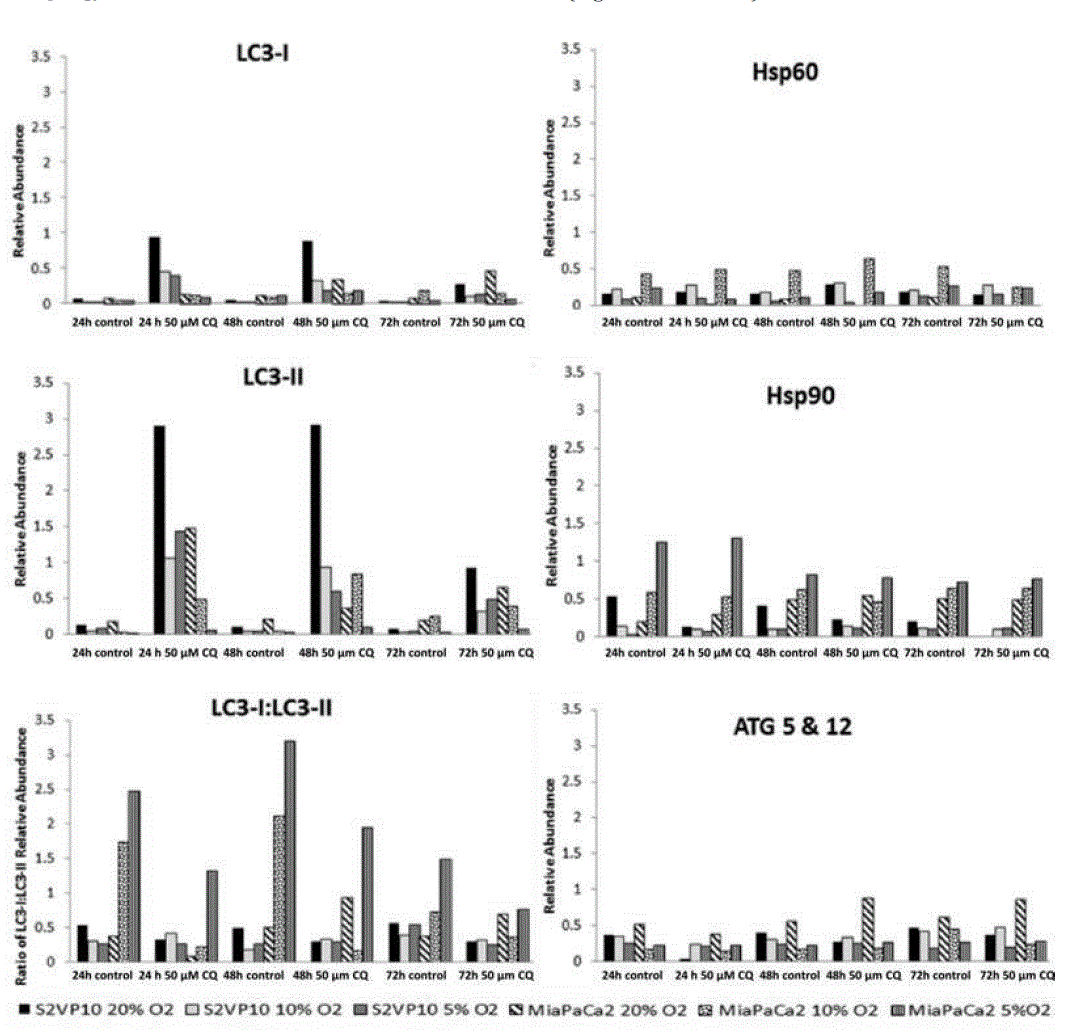
| Figure 7. Analysis of Western blot data using dosimetry. Data suggest an increase in LC3-II for S2VP10 cells when treated with chloroquine in normoxia for 24, 48, or 72 hours compared to untreated cells. These levels also increased in hypoxia, although apparently less than the amounts measured for the normoxic cases. In general, variability in expression of Hsp60, Hsp90, and ATG5 and 12 under all conditions may reflect variation in cellular stress associated with chloroquine exposure, treatment duration, and hypoxic conditions. (The values are reported for one experiment. These data are included as additional supporting information for the results in Figure 6). |