 |
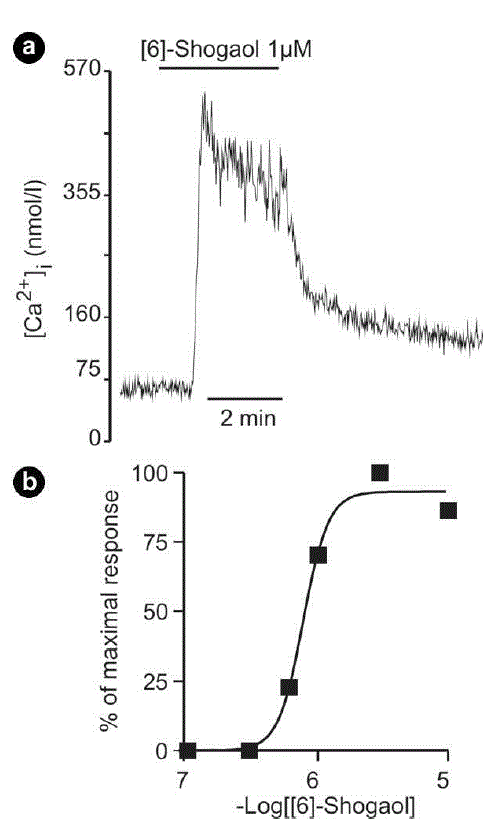
| Figure 1. [6]-shogaol increased [Ca2+]i in a dose-dependent manner. Effect of [6]-shogaol on [Ca2+]i in the INS-1E cells was measured by microfluorometry, using fura-2 as the Ca2+ indicator. a. The trace shows [Ca2+]i increase by [6]-shogaol (1 μM). The trace is representative of at least three experiments. b. Concentration-response curve for [6]-shogaol-induced [Ca2+]i increase. Maximal increase of [Ca2+]i was obtained by 3 μM [6]- shogaol. Each data point represents mean of at least three experiments. |