 |
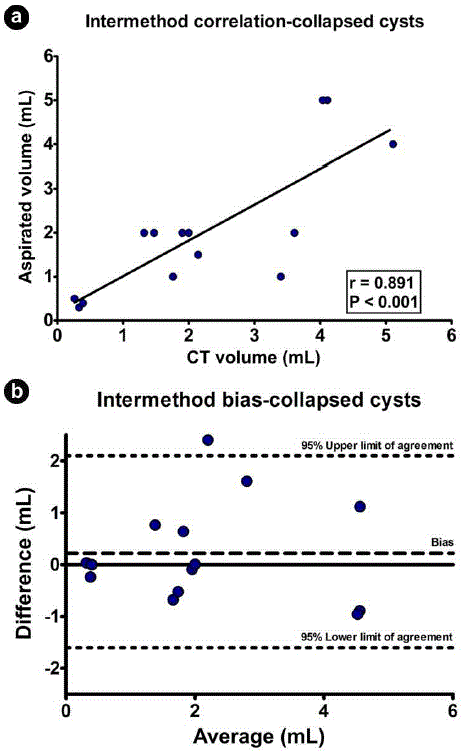
| Figure 5. a. Intraclass correlation between aspirated volume by EUS and CT volumetry. b. Bland-Altman plot depicting the bias (0.22 mL) and 95% limits of agreement (-1.68 to 2.14 mL) for CT volumetry. Mean CT volumetry was 2.27±1.54 mL. Mean aspirated volume was 2.05±1.56 mL |