 |
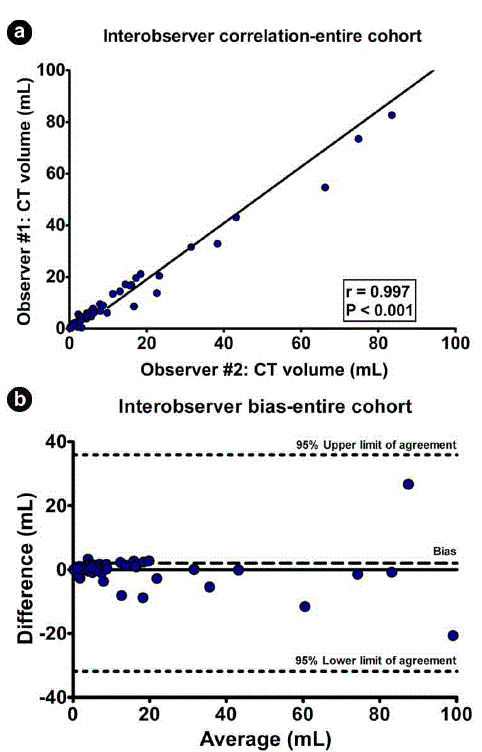
| Figure 3. a. Intraclass correlation between two observers in calculating volume of the entire cohort by CT volumetry. b. Bland-Altman plot depicting the bias (2.0 mL) and 95% limits of agreement (-31.8 to 35.9 mL) in calculating volume by CT volumetry. Mean CT volumetry was 55.5±155.9 mL and 53.5±146.4 mL for observers #1 and #2, respectively. |