|
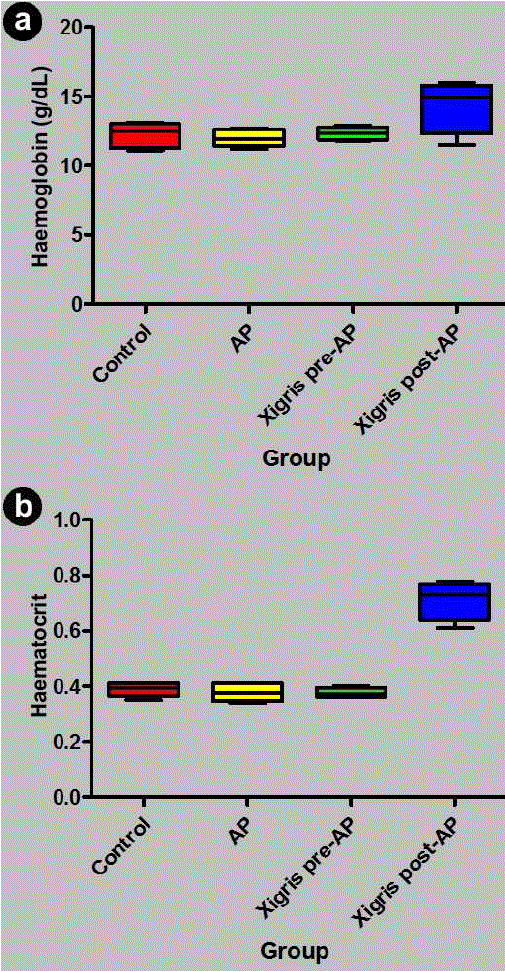
| Figure 2. Haemoglobin (a.) and haematocrit (b.) in the four study groups. Data are presented as box and whisker plot with central line representing median, upper and lower limits of box representing interquartile range and whiskers representing outliers. AP group: acute pancreatitis group |