 |
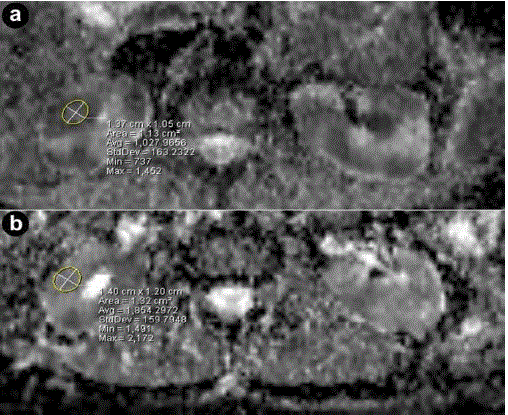
| Figure 5. Axial apparent diffusion coefficient (ADC) maps from diffusion weighted MR images at the level of the kidneys. Pretreatment ADC values in right kidney was 1.027 x10⁻³ mm/sec2 and post-treatment ADC values increased to 1.854 x10⁻³ mm/sec2 (80.5% increase) which is compatible with favorable response to steroid treatment. |