|
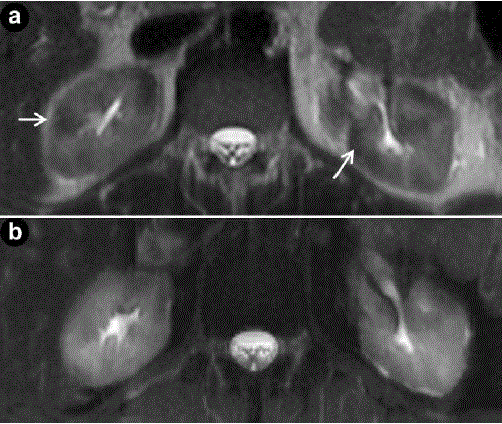
| Figure 2. Pre-treatment (a.) and post-treatment (b.) T2- weighted axial images through the kidneys. Pre-treatment T2 weighted images demonstrate areas of decreased signal intensity (arrows) representing renal manifestations of autoimmune pancreatitis. |