 |
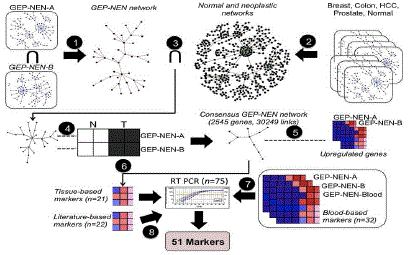
| Figure 1. Pipeline used to derive a set of 51 markers that identify gastroenteropancreatic neuroendocrine tumors. Two GEP-NEN gene expression datasets were analyzed (GEP-NEN-A and GEPNEN- B). 1) GEP-NEN-A: small intestinal tissue (n=3; macroscopically normal mucosa collected at surgery), primary GEPNENs (n=6), and metastatic GEP-NENs (n=3). 2) GEP-NEN-B: normal ileal mucosa (n=6), primary midgut neuroendocrine neoplasias (n=3), and liver metastases (n=3). Step 1. Gene co-expression networks inferred from GEP-NEN-A and GEP-NEN-B datasets are intersected, producing the GEP-NEN network. Step 2. Co-expression networks from neoplastic and normal tissue microarray datasets are combined to produce the normal and neoplastic networks. Step 3. Links present in normal and neoplastic networks are subtracted from the GEP-NEN network. Step 4: Concordantly regulated genes in GEP-NEN-A and GEP-NEN-B networks are retained; other genes are eliminated from the GEP-NEN network, producing the Consensus GEP-NEN network. Step 5. Upregulated genes in both the GEPNEN- A and GEP-NEN-B dataset are mapped to the Consensus GEP-NEN network. Step 6. Topological filtering, expression profiling, and literature-curation of putative tissue-based markers, yielding 21 putative genes further examined by RT-PCR. Step 7. Identification of mutually upregulated genes in GEP-NEN blood transcriptome and GEP-NEN-A and GEP-NEN-B datasets, yielding 32 putative genes further examined by RT-PCR. Step 8. Literature-curation and cancer mutation database search, yielding a panel of 22 putative marker genes for further RT-PCR. (Adopted with permission from Modlin et al. 2013 [20]). GEP-NEN: gastroenteropancreatic neuroendocrine neoplasia |