|
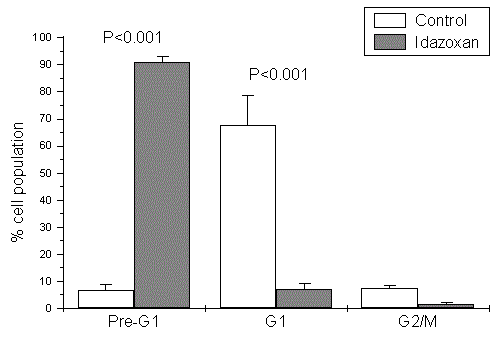
| P values relative to idazoxan vs. control |
| Figure 3: Effect of idazoxan on DNA integrity in BRIN-BD11 cells. Cultured BRIN-BD11 cells were exposed to either vehicle (control) or idazoxan (100 μM) for 20 h. After this time the cells were harvested and fixed for analysis of cellular DNA integrity by fluorescence activated cell counting. The proportion of cells with fragmented (pre-G1), intact (G1), or replicated (G2/M) DNA was quantified. Areas under the peaks were integrated and are presented as mean values±SEM. |