 |
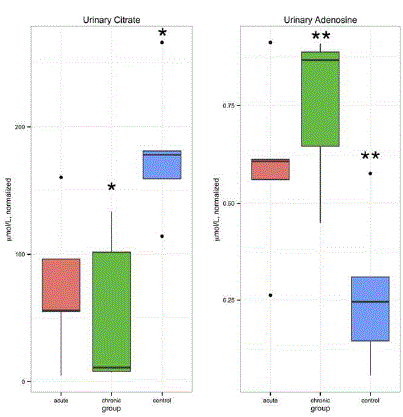
| Figure 1. Boxplots depict concentrations of two significant metabolites identified after Wilcoxon rank-sum tests and validation by random permutation. Data are reported in μmol/L (normalized). Citrate (left) concentration was significantly lower in chronic pancreatitis (CP) patients compared to healthy controls (* P=0.019). Adenosine (right) concentration was significantly higher in chronic pancreatitis patients compared to healthy controls (** P=0.026). The box covers the first (Q1) and third (Q3) quartile of the data. The line in the box represents the median value. The whiskers extend to ±1.5 interquartile range (IQR), where IQR=Q3-Q1. Outliers are shown as points. |