 |
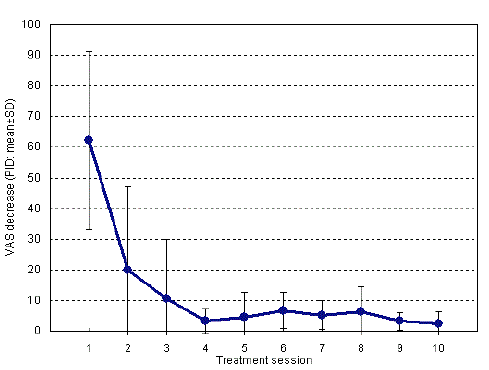
| Figure 4: Pain intensity difference values (PID: mean±SD VAS score difference before and after each treatment). The gradual flattening of the curve is indicative of a reduction in the differences as the number of treatment sessions increases. The phenomenon is due to a rising pain threshold, which is reflected in a lower pre-treatment baseline VAS, while the post-treatment VAS can never be negative. Several peaks may realistically be ascribed to other possible causes as the disease progresses. |