 |
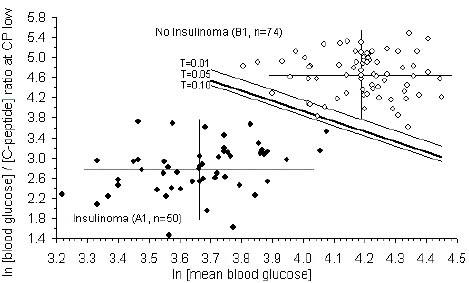
| Figure 6. Mean blood glucose vs. [blood glucose]/[Cpeptide] ratio at lowest C-peptide concentrations from fasting tests. Data are plotted as a natural logarithm (ln) in patients with insulinoma (closed circles; Group A1, n=50) and patients without insulinoma (open circles; Group B1, n=74). Mean values±2 SD are indicated for both groups. The lines represent the discriminant criteria for the possibility thresholds T=0.01, 0.05, and 0.10. |