Keywords
2-DGE; 1-DGE; Proteome; IPG; Seed proteins
Introduction
Two-Dimensional Polyacrylamide Gel Electrophoresis (2-D PAGE) has been extensively used for separation and characterization of proteins. Commonly, the first-dimension separation occurs in a gel strip, which is then positioned across the top of a second slab gel for separation in the second dimension. 2-D PAGE, which separates polypeptides according to two independent criteria, charge (p1) and Molecular Weight (MW), is a powerful technique for analyzing complex mixtures of denatured proteins [1]. The fields of application of this technique are numerous. For instance, in plants, 2-D PAGE is the technique of choice for detecting and quantifying modifications of genome expression under different stresses or in response to hormones, pathogenic infections, symbiosis and cultivar identification [2,3]. Assessment of genetic polymorphism using 2-D PAGE has not been widely reported. The variability within and between species has been investigated by comparing 2-D gels in wheat [4-8], barley [9], sugarcane [10], maize [11,12], maritime pine [13] and Globodera [14].
Sorghum [Sorghum bicolor (L.) Moench] ranks fifth in the world being surpassed only by rice, wheat, barley and maize [15]. Sorghum is cultivated across the world in the warmer climatic areas [16]. It is unique to adapt to environmental extremes of abiotic and biotic stresses and an essential crop to diets of poor people in the semi-arid tropics where droughts cause frequent failures of other crops [17]. Sorghum, in particular, could also play an important role in the production of ethanol and other bio-industrial products such as bioplastics, especially in dry areas where other crops are not as easily grown [18].
The protein content of grain sorghum is approximately 13% [19], of which the kafirins comprise over 80% of the protein in the endosperm component of the grain [20]. Kafirins, the major storage proteins, are classified as prolamins and as such, they contain high levels of proline and glutamine and are soluble in non-polar solvents such as aqueous alcohols. The kafirins are categorized into α, β, γ based on molecular weight and solubility [21]. The protein component of the endosperm is estimated to contain between 9-21% γ-kafirin and 66-84% α -kafirins [22]. The kafirins are assembled into discrete Protein Bodies (PB) in the ER, whereby the a-kafirins compose the core and the b-and c-kafirins decorate the periphery of the PB. It is thought that the organizational structure of the PB has a major impact on protein digestibility of sorghum food and feed products [23].
Sorghum proteins have been used to produce biodegradable films [24-26] Sorghum proteins have been extracted from Sorghum bran for commercial production. Sorghum is safe for celiac patients [27]. Celiac disease is an autoimmune reaction to the ingestion of the prolamin proteins found in wheat (gluten), rye (secalin) and barley (hordein). It is a serious enteropathic condition that affects 1 in 133 Americans [28].
Sorghum protein has numerous nutritional and functional properties that are important to the dietary requirements of protein for people and animals. It is also important in malting and beer brewing [29,30]. However, a major drawback of Sorghum is its high levels of phenolic compounds. Phenolic compounds are secondary plant metabolites and mainly exist in Sorghum as phenolic acids, flavonoids and tannins [31]. Phenolic compounds can interact with protein to influence its physical and biochemical properties, producing negative effects such as a sensation of astringency and lower nutritional value, [32] or positive effects such as repellent characteristics [33] and the improvement of protein functionality [34] and also studied their free radical scavenging activity [35,36] which interfere with the extraction of seed storage proteins and their separation by electrophoresis. Therefore, this study has investigated the distribution and content of pigmented and non-pigmented in different cultivar varieties by using 1-Dimensional and 2- Dimensional Gel Electrophoresis (2-DGE). The previous reports of sorghum seed proteins had only in 1-Dimensional Gel Electrophoresis (SAD-PAGE) [37-41]. There is no systematic proteome-level study on Sorghum seed as a whole and specifically on Sorghum seed using high-resolution of 2-DGE for cultivar differentiation.
However, we have optimized here a 2-DGE based total seed proteome approach for sorghum as a first step towards our goal to establish a comprehensive proteome map of different Sorghum cultivars. In this study, a 2-DGE based proteome approach was applied to six sorghum genotypes.
Materials and Methods
Seed material
Six different varieties of non-pigmented and pigmented Sorghum bicolor (L.) Moench Viz., IS 3477, IS 33095, IS 7005 (non-pigmented) IS 2898, IS 7155, IS 1202 (pigmented) have been used in the present study. The seed materials were obtained from International Crops Research Institute for the Semi-Arid Tropics (ICRISAT), Patancheru, Hyderabad Andhra Pradesh, India. All the varieties were maintained through selfpollination. Cross-pollination was prevented by covering the panicles with brown paper bags. All varieties were grown in the experimental farm of the Department of Botany Andhra University and Visakhapatnam for further analysis.
Sorghum seed protein extraction
Mature panicles were collected from experimental research farm that one gram seed of each variety ground to a fine powder with the help of liquid nitrogen using mortar and pestle and the powder was then suspended in cold acetone containing 10% (w/v) Trichloroacetic Acid (TCA) and 1% (w/v) dithiothreitol (DTT), vortexed and kept at -20°C for overnight. Each sample was centrifuged at 30,000 rpm for 20 min at 4°C. The resulting pellet was washed twice by re-suspending in cold acetone containing 1% DTT, for 1 h each at -20°C, before further centrifugation at 30,000 rpm for 20 min at 4°C. The resulting pellet was vacuum dried, solubilized in freshly prepared lysis buffer containing 8 M urea, 4% (w/v) CHAPS, 10 mM DTT and 1% (v/v) ampholyte (pH 3-10) and then centrifuged at 15,000 rpm for 20 min. The supernatant was submitted to a second clarifying centrifugation at 30,000 rpm for 20 min and the resulting supernatant was used to assay for protein content and for 1-DE and 2-DE. The protein concentration was determined by Bradford assay using bovine serum albumin as the standard.
Two-dimensional gel electrophoresis
Rehydration of 7 cm IPG strips: For the 2-DGE analysis the first-dimension Isoelectric focusing (IEF) was performed using 7 cm pH 3-10 linear immobilized pH Gradient (IPG) strips in the IPG phor system. Protein extracts were diluted in rehydration solution (7 M urea, 2 M thiourea, 18 mM Tris-HCl pH 8.0, 4% (w/v) CHAPS, 0.5% (v/v) IPG buffer in same range as the IPG strip and 0.002% Bromophenol Blue containing 1.6% (v/v) Destreak Reagent). All IPG strips were rehydrated with 450 μL rehydration buffer containing 150 μL of protein sample of each variety with DTT. The strips were then covered with mineral oil (Plus One Dry Strip Cover Fluid; GE Healthcare) to prevent sample evaporation during the rehydration process and left to passively rehydrate to their original gel thickness of 0.5 mm for at least 15 hrs at room temperature.
First dimension Isoelectric Focusing (IEF) of IPG strips: After the rehydration process, IPG strips were briefly rinsed with distilled water to remove unabsorbed protein sample and carefully blotted with moist filter paper. The strips were then placed gel side up on the focusing platform of an Ettan™ IPGphor II™ (GE Healthcare). Distilled water moistened wicks were placed at the extreme ends of both the anodic and cathodic ends of the IPG strips to collect excess salts and impurities from the sample during focusing. The IPG strips were then covered with mineral oil to avoid sample evaporation and carbon dioxide absorption during focusing. Isoelectric focusing was performed in a threephase stepwise programme at 20°C as 500 V for 750 Vh, 1000 V for 2000 Vh and 8000 V for 24 k Vh to 7 cm IPG strips.
Gel image analyses
After separation of the stained gels were scanned with an Image Scanner and analyzed with Image Master Platinum software V.50 (GE-Healthcare®). The authenticity of each spot of protein was validated and edited by visual inspection. A synthetic gel, containing only spots present in all the six gels of each mature seed stage (Six biological samples with two gels each), was obtained and used to validate the presence of spots in all repetitions. The number, percentage of volume criterion, distribution of spots and intensity, area and saliency were evaluated. Synthetic gels were used to quantify the number of spots per stage, differential expression of proteins using the percentage volume criterion and differential distribution of proteins in accordance with molecular weight and isoelectric point. Prior to differential protein expression analysis across treatment groups of each experiment, spots were manually edited using the group consensus tool to obtain spot expression consensus in all two biological replicates per treatment group. Differentially expressed protein spots were either qualitative (present/absent spots), quantitative (showing at least a 2-fold expression change). After analysis gels were dehydrated in a solution containing 30% methanol and 3% glycerol and then stored at room temperature until mass spectrometry identification of differentially expressed polypeptides.
Results
Two-dimensional gel electrophoresis (2-DGE) analysis of total seed proteins
The present investigation goal was to work towards the establishment of a sorghum seed proteome map. The 2-DGE procedure to study the expression profiles and comparative proteomic analysis of a Sorghum seed protein was successfully optimized. TCA/Acetone seed protein extraction of six Sorghum varieties was separated by 2-DGE using 7 cm range of pH 3-10 IPG (Immobilized pH gradient) strips in the first dimension of Isoelectric Focusing (IEF) and second dimension 12 % (v/v) SDS PAGE gels for separation of storage proteins. In the present study, 150 μg of equal concentration protein was applied to each gel and to visualize protein bands gel was stained with colloidal Coomassie Brilliant Blue (CBB). A total 645 protein spots were obtained in these six varieties of Sorghum i.e., IS 3477, IS 33095, IS 7005, IS 2898, IS 7155 and IS 1202 of each variety resolved approximately protein spots 116, 140, 109, 98, 80 and 102 respectively. The total spots of each gel were highest in the variety IS 33095 (140) followed by IS 3477, IS 7005, IS 2898, IS 1202 and IS 7155. Figure 1 shows that the proteins of each variety were well separated in the pI range of 3-10 and the molecular weight range of 15.5 to 90 kDa. For all the samples, the pH range 3-10 IPG strips were used because most of the soluble proteins fell within that pH range. Here we have observed that the spot resolution, volume, intensity, saliency, and percentage of spot volume abundance between two biological replicate gels of each of the various extracts were uniform. The intensity, area, volume, % of volume and saliency of each protein spot were calculated by using 2-DGE Image master software (V.50, GE Healthcare). We further analyzed six varieties of gel regions of the area which ranges of the pH 3.5-7.5 showed distinctive separation with good intensity of the protein spots in non-pigmented varieties i.e., IS 3477, IS 33095 and IS 7005 (Figure 1A-C).
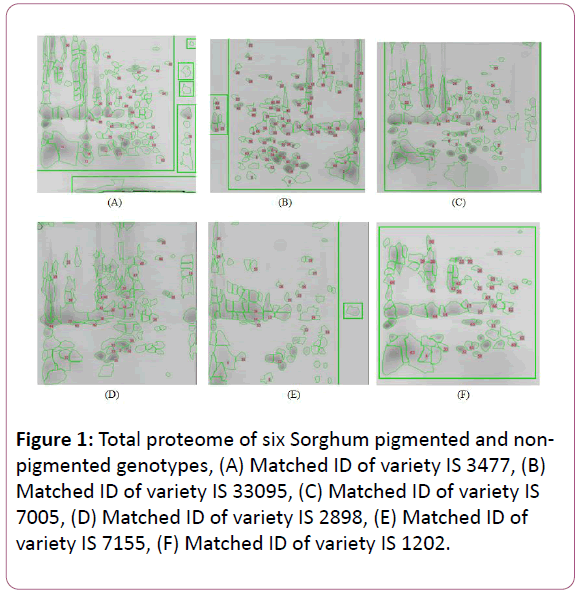
Figure 1: Total proteome of six Sorghum pigmented and nonpigmented genotypes, (A) Matched ID of variety IS 3477, (B) Matched ID of variety IS 33095, (C) Matched ID of variety IS 7005, (D) Matched ID of variety IS 2898, (E) Matched ID of variety IS 7155, (F) Matched ID of variety IS 1202.
In our study, we observed the major protein spots present in the range of pI from 5.0 to 7.5 constituted about 30% (relative quantity) of the total extractable protein, while the minor proteins present in the range of molecular weight (kDa) from 65.0 to 88.0 constituted about 25%, as calculated by using Image Master software. A few differences in protein spots were observed between the pigmented and non-pigmented varieties. The result indicates that the comparative total proteome analysis of sorghum genotypes was shown considerable differences (Figure 1). Although in general, the protein profile of the six varieties was similar. In non-pigmented varieties above 100 protein spots were resolved in the respective gels of each genotype by 2-DGE while in pigmented varieties below 100 protein spots were resolved except IS 1202 with 102 resolved protein spots. In this study, when compared the six varieties we observed differential matched ID (Protein spots that are propagated from one image are compared for multiple matches with the other protein spots of other matched images can be referred to as matched ID, this allows quantification of identical areas of each gel) in each of the variety i.e., IS 3477 matched with 35 protein spots, the variety IS 33095 matched with 83 protein spots, the variety of IS 7005 matched with 34 protein spots were found in non-pigmented varieties. Whereas pigmented varieties IS 2898, IS 7155, IS 1202 matched with 30, 19 and 33 protein spots respectively (Figure 1). The Percentage of volume in six varieties was also investigated in this study. In non-pigmented varieties, protein spots had an average volume of each variety i.e., IS 3477 (1.020408%), IS 33095 (1.208248%) and IS 7005(1.062069%) (Figure 2). Whereas in pigmented varieties, protein spots had an average volume of each variety IS 2898 (0.917433%) IS 7155 (0.714286%) and IS 1202 (0.980392%) (Figure 2). The six varieties of protein spots of average intensity, area, volume, % of volume and salience were lowest in pigmented varieties when compared with non-pigmented varieties. The total 645 protein spots of the six varieties, 91 protein spots showed some difference in their expression levels among the varieties. Most of the proteins were located in the molecular weight (MW) 10-70 kDa and 3.5-9.5 isoelectric point (pI) ranges of each variety spot.
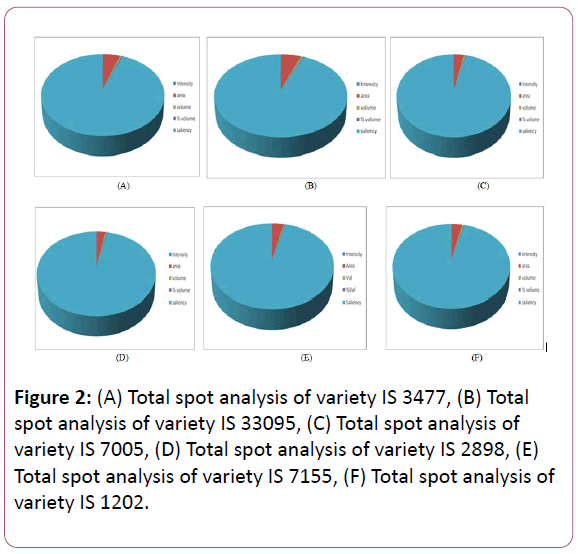
Figure 2: (A) Total spot analysis of variety IS 3477, (B) Total spot analysis of variety IS 33095, (C) Total spot analysis of variety IS 7005, (D) Total spot analysis of variety IS 2898, (E) Total spot analysis of variety IS 7155, (F) Total spot analysis of variety IS 1202.
In the present investigation, we observed the differential proteins among the six varieties were positioned largely in 3 specific areas of each gel as showed. Noticeably, some of the differentiating proteins in the range were as a line form in the region of 30-40 kDa with similar molecular weight but with different pI values. The most vertical streaking region that differentiated varieties had proteins in the 30-90 kDa range with 4.0 to 7.5 pI range. In this streaking region, 15 proteins either fully present versus absent or different levels of expression between the varieties. Among the six cultivars, the nonpigmented varieties of IS 3477, IS 33095, IS 7005 were resolved by 2-DGE more protein spots than pigmented varieties in the streaking region. It indicated that the protein content is very low and some nonprotein bioactive compounds like polyphenols might be interfering in pigmented varieties than non-pigmented varieties (Figure 2).
Analysis of comparative proteome between the six sorghum genotypes
Up-regulated of protein spots: When the percentage of volume and normal volume were more than 1%, it indicates those proteins as up-regulated proteins. In this study, we observed among the six varieties of Sorghum pigmented and non-pigmented up-regulated protein spots i.e., IS 3477 (28 spots) IS 33095 (25 spots) IS 7005 (24 spots), IS 2898 (31 spots), IS 7155 (28 spots) and IS 1202 (26 spots) in total 162 upregulated protein spots were identified by using Image master software of 2-DGE (Table 1).
| Genotypes of sorghum |
a)Total spots |
b)Up-regulated protein spots |
c)Down-regulated protein spots |
d)Qualitative |
e)Quantitative |
f)Common protein spots |
g)Specific protein spots |
| IS 3477 |
116 |
28 |
88 |
24 |
26 |
94 |
12 |
| IS 33095 |
140 |
25 |
115 |
20 |
30 |
120 |
20 |
| IS 7005 |
109 |
24 |
85 |
10 |
18 |
86 |
23 |
| IS 2898 |
80 |
31 |
49 |
12 |
10 |
69 |
11 |
| IS 7155 |
98 |
28 |
70 |
9 |
12 |
88 |
10 |
| IS 1202 |
102 |
26 |
76 |
16 |
13 |
85 |
17 |
| Total |
645 |
162 |
483 |
91 |
109 |
542 |
93 |
a) A total number of reproducible spots amongst two independent biological replicate gels of each sorghum variety.
b) up-regulated of each genotype protein spots
c) Down-regulated of each genotype protein spots
d) Variety specific qualitative proteins spots
e) Spots showing the quantitative change between the six Sorghum varieties
f) Common protein spots of each genotype
g) Specific proteins of each genotype
Table 1: Summary of comparative total seed proteomes of six varieties of sorghum.
Down-regulated of protein spots: When the percentage of volume and normal volume were less than 1%, it indicates those proteins as down-regulated proteins. In this study, the total of 483 down-regulated protein spots was identified in the six gels of Sorghum. Among the six varieties of pigmented varieties resulted IS 2898 (49 spots), IS 7155 (70 spots), IS 1202 (76 spots) down-regulated protein spots, while non-pigmented varieties IS 3477 (88 spots) IS 33095 (115 spots) IS 7005 (85 spots) downregulated protein spots were shown in (Table 1).
Qualitative protein spots: In the six varieties, the qualitative proteins that were identified of each variety i.e., 24, 20, 10, 12, 9 and 16 spots were exclusively expressed in IS 3477, IS 33095, IS 7005, IS 2898, IS 7155 and IS 1202 respectively (Table 1).
Quantitative protein spots: Of the 500 above common proteins, a total of 109 spots showed quantitative variation in expression level by at least a 2-fold margin (≥ 2-fold) between the six Sorghum varieties (Table 1). These were equally distributed between pigmented and non-pigmented varieties of Sorghum.
Common protein spots: Among the six gels of each variety approximately 500 above protein spots were common in each genotype. The proteins of the six genotypes were expressed similarly except in pigmented genotypes (Table 1).
Specific protein spots: The specific proteins of the six genotypes that were shown in each genotype i.e., IS 3477 (12), IS33095 (20), IS 7005 (23), IS 2898 (11), IS 7155 (10) and IS 1202 (17) which were expressed in different pH ranges (Table 1).
Discussion
In the present study, we have focused on variation in the Sorghum storage proteome among different cultivars of pigmented and non-pigmented. In the past, traditional protein analysis methods failed to reveal the vast variations among germplasms, especially cultivars. The current study demonstrated that 2-DGE technology is a powerful and highresolution approach to reveal the extent of variations among cultivars. Some proteomes are relatively small, containing a few hundred proteins or less, while others contain thousands of proteins. One-Dimensional (1D) separation techniques do not have the resolving power to separate complex mixtures. The combination, however, of orthogonal separation techniques can provide the required resolving power. Furthermore, it is important that the quantitative aspect of the proteome be conserved through the separation technique. About 30 years ago, a technique called 2D gel electrophoresis was introduced and this technique satisfied the resolving power requirement while conserving the quantitative aspect of the proteome. Twodimensional gel electrophoresis has been the method of choice for the large-scale purification of proteins in proteomic studies. The 2D gel electrophoresis method can potentially separate several thousand proteins in a single experiment [42,43].
In the current study, detection of above 600 spots using the 2- DGE based proteomic approach indicated that in general the patterns of proteins among the cultivars were similar. Homology of many common protein spots among the cultivars allowed the identity of the differentiating proteins to be assigned on the basis of their electrophoretic mobility. A total of 94 protein spots showed some differences in their expression levels among the cultivars but we only considered the spots having more than 2.5 fold variations as qualifying for a differentiating protein. This variation of observation has been reported in other studies of cereals [44-46]. Seed protein composition is generally genetically controlled [47] although some environmental effects would be expected. All the samples studied in this study were grown at the same experimental conditions, suggesting that the proteomic variations revealed by the current study were due to the genetic variation.
In the present investigation, we used 2-DGE to analyze the total seed proteins of Sorghum, whereas [48,49] used conventional 2-D DIGE in wheat grains. The 2-DE procedure has more accurate spot detection on power than the conventional 2-D DIGE revealed in wheat. Meanwhile, the Sorghum samples used for protein separation in the present study and these for were different. Since the grain endosperm is a rapidly developing tissue, many factors including tissue collecting time and growth condition may have accounted for part of the observed difference.
In the present investigation, the 2-DGE has clearly identified major proteins with altered expression in mature seed of Sorghum using TAC/Acetone extraction method. Trichloroacetic Acid (TCA) in combination with acetone (TCA/acetone) is routinely used for the extraction of plant proteins [50]. The low pH of TCA inhibits protein degradation by inactivating most protease activities. Acetone solubilizes non-protein components of the extract that might interfere with gel electrophoresis, leaving an acetone-insoluble protein precipitate [51]. In animal cells, lysosomal proteases are active at low pH and inactivated at high pH and therefore would require a different mechanism for deactivation. Using the TCA/acetone method, acetoneprecipitated proteins are subsequently solubilized in a buffer of choice prior to IEF. However, protein losses may be encountered using this method mainly because of incomplete protein precipitation. Even when protein precipitation is nearly complete, some proteins particularly high molecular weight proteins [52] may not readily resolubilize in solubilization buffers [53]. The study of TCA/Acetone protein extraction in the similar proteome of Maize [54] and soybean was analyzed by [55,56], who used the TCA/Acetone precipitation followed by lysis in a buffer containing urea, CHAPS and DTT, this permitted the detection of total 300 reproducible protein spots. During the analyses of fruit and vegetable proteomes, additional steps of methanol washes of the protein precipitate are included to remove polyphenolic compounds that are highly abundant in such plant materials. In this study, we observed vertical and horizontal streaking among these six varieties of 2-D gels. Polyphenols can irreversibly complex with proteins during extraction and lead to horizontal and vertical streaking in 2D gel profiles and thus a reduction in gel resolution [57].
Conclusion
The 2-DGE method worked well for both the Pigmented and non-pigmented seeds of sorghum. The analysis of the proteome profiles on the gels (using PD-Quest analyzer) and densitometry scans of the same protein profiles on the gels, surprisingly showed that there was no variation within and between the species. We suggest that 2-DGE be used as a rapid and reliable method for routine identification of sorghum genotypes in breeding programs. Precise differentiation in protein spots patterns is possible on the basis of the presence or absence of unique polypeptides. Their spot analysis allows the ranging of genotypes in either pigmented or non-pigmented, which could also be used for the breeder’s needs as protein biomarkers, as well as in the seed industry [58,59].
Acknowledgment
The authors sincerely thank Head, Department of Botany for their financial support from the University grants commission as RFSMS and also S.K Univerity, Department of Botany for providing the necessary 2-Dimensional gel electrophoresis unit.
References
- O’Farrell PH (1975) High-resolution two-dimensional electrophoresis of proteins. J Biol Chem 250: 4007-4021.
- Ferullo JM, Nespoulous L, Triantaphylides C (1994) Gamma-ray-induced changes in the synthesis of tomato pericarp proteins. F Cell Env 17: 901-911.
- Damerval C, Zivy M, Granier F, De Vienne D (1988) Two-dimensional electrophoresis in plant biology. Advn in Elect 2: 236-340.
- Zivy M, Thiellement H, De Vienne D, Hofmann JR (1984) Study on nuclear and cytoplasmic genome expression in wheat by two-dimensional gel electrophoresis. 2. Genetic differences between two lines and two groups of cytoplasms at five developmental stages or organs. Theor App Genet 68: 335-345.
- Bahrman N, Cardin ML, Sequin M, Zivy M, Thiellement H (1988). Variability of 3 cytoplasmically encoded proteins in the Triticum genus. Heredity 60: 87-90.
- Bahrman N, Zivy M, Thiellement U (1988) Genetic relationship in the Sitopsis section of Triticum and the origin of the B genome of polyploid wheats. Heredity 61: 473-480.
- Thiellement H, Seguin M, Bahrman N, Zivy M (1989) Homoeology and phylogeny of the A, S and D genomes of the Triticinae. J Mol Evol 29: 89-94.
- Zivy M, el Madidi S, Thiellement H (1995) Distance indices in a comparison between the A, D, I and R genomes of the Triticeae tribe. Electrophoresis 16: 1295-1300.
- Gorg A, Postel W, Baumer M, Weiss W (1992) Two-dimensional polyacrylamide gel electrophoresis, with immobilized pH gradients in the first dimension, of barley seed proteins: discrimination of cultivars with different mating grades. Electrophoresis 13: 192-203.
- Ramagopal S (1990) Protein polymorphism in sugarcane revealed by two-dimensional gel analysis. Theor Appl Genet 79: 297-304.
- Higginbotham JW, Smith SC, Smith OS (1991) Quantitative analysis of two-dimensional protein profiles of inbred lines of maize (Zea mays L.). Electrophoresis 12: 425-431.
- Burstin J, de Vienne D, Dubreuil P, Damerval C (1994) Molecular markers and protein quantities as genetic descriptors in maize. I. Diversity among 21 inbred lines. Theor Appl Genet 89: 943-950.
- Bahrman N, Zivy M, Damerval C, Baradat PI (1994) Organization of the variability of abundant proteins in seven geographical origins of maritime pine (Pinus pinaster Ait.). Theor Appi Genet 88: 407-411.
- Bossis M, Mugniery D (1993) Specific status of six Globodera parasites of Solanaceous plants studied by means of two-dimensional gel electrophoresis with a comparison of gel patterns by a computed system. Fundam Appi Nematol 16: 47-56.
- Abunyewa AA (2008) Efficient utilization of water and nitrogen resources for grain sorghum under rainfed conditions. University of Nebraska-Lincoln.
- Olatunji O, Jibogun AC, Anibaba TS, Oliyide VO, Ozumba AU, et al. (1993) Effect of different mashing procedures on the quality of sorghum beer. J AmerI Soci of Brew Chemi 51: 67-70.
- Godbharle AR, More AW, Ambekar SS (2010) Genetic variability and correlation studies in elite ‘B’ and ‘R’ lines in Kharif Sorghum. Electronic J Pl Br 1: 989-993.
- McLaren JS, Lakey N, Osborne J (2003) Sorghum as a bioresources platform for future renewable resources. Proceedings 57th Corn and Sorghum Research Conference. CD ROM. American Seed Trade Association, Alexandria, VA, USA.
- Beta T, Rooney LW, Waniska RD (1995) Malting characteristics of sorghum cultivars. Cereal Chem 72 533-538.
- Hamaker BR, Mohamed AA, Habben JE, Huang CP, Larkins BA (1995) Efficient procedure for extracting maize and sorghum kernal proteins reveals higher prolamin contents than conventional method. Cereal Chem 72: 58-588.
- Belton PS, Delgadillo I, Halford NG, Shewry PR (2006) Kafirin structure and functionality. J Cereal Sci 44: 272-286.
- De Mesa-Stonestreet NJ, Alavi S, Bean SR (2010) Sorghum proteins: the concentration, isolation, modification and food applications of kafirins. J Food Sci 75: 90-104.
- Hicks C, Bean SR, Lookhart GL, Pedersen JF, Kofoid KD, et al. (2001) Genetic analysis of kafirins and their phenotypic correlations with feed quality traits, in vitro digestibility and seed weight in grain sorghum. Cereal Chem 78: 412-416.
- Buffo RA, Weller CL, Gennadios A (1997) Films from laboratory extracted Sorghum kafirin. Cereal Chem 74: 473-475.
- Emmambux MN, Stading M, Taylor JRN (2004) Kafirin film property modification with tannins. J Cereal Sci 40: 127-135.
- Da Silva LS, Taylor JRN (2004) Sorghum bran as a potential source of kafirin. Cereal Chemistry 81: 322-327.
- Ciacci C, Maiuri L, Caporaso N, Bucci C, Del Giudice L, et al. (2007) Celiac disease: In vitro and in vivo safety and palatability of wheat-free Sorghum food products. Clin Nutr 26: 799-805.
- Fasano A, Berti I, Gerarduzzi T, Not T, Colletti RB, et al. (2003) Prevalence of celiac disease in at-risk and not-at-risk groups in the United States: a large multicenter study. Arch Intern Med 163: 286-292.
- Taylor JRN (1983) Effect of malting on the protein and free amino nitrogen composition of sorghum. J Sci Food Agri 34: 885-892.
- Taylor JRN, Dewar J, Taylor J, Von Ascheraden RF (1997) Factors affecting the porridge-making quality of South African sorghums. J Sci Food and Agri 73: 464-470.
- Thaddi Hahn DH, Rooney LW, Earp CF (1984) Tannins and phenols of Sorghum. Cer Foods World 29:776-779.
- Haslam E, Lilley TH, Warminski E, Liao H, Cai Y, et al. (1992) Polyphenol complexation, a study in molecular recognition, in phenolic compounds in food and their effects on health: Analysis, occurrence and chemistry, ed. by Ho CT, Lee CY and Huang MT. American Chemical Society, Washington, DC, 89: 8-50.
- Roger WB, Melvyn VG, Garrison SRK, John OY (1980) Laboratory comparisons of polyphenols and their repellent characteristics in bird-resistant Sorghum grains. J Agric Food Chem 28: 1006-1011.
- Taylor JRN, Schober TJ, Bean SR (2006) Novel food and non-food uses for sorghum and millets. J Cereal Sci 44: 252-271.
- Naidu BT, Mani NS, Varaprasad B (2009) Antioxidant and Free radical Scavenging activity of Sorghum bicolor (L.) Moench. J Pharmacy Res 2: 1659-1662.
- Thaddi BN, Nallamilli SN (2014) Assay of in vitro free radical scavengers and their antioxidant activity of Sorghum (Sorghum bicolor (L.) Moench). Int J Bioassay 3: 3350-3357.
- Alam S, Sandal PC (1969) Electrophoretic analysis of anther proteins from male fertile and male sterile sudangrass Sorghum vulgare var sudanensis (Piper). Crop Sci 9: 157-159.
- Taylor JN, Schussler L (1984) Sorghum cultivars verification by electrophoresis. J Sci Food Agric 35: 1-3.
- Bean SR, Lookhart GL, Beitz JA (2000) Acetonitrile as a buffer additive for free zone capillary electrophoresis separation and characterization of maize (Zea mays L.) and sorghum (Sorghum bicolor L. Moench) storage proteins. J Agric Food Chem 48: 318-327.
- Krueger CG, Vestling MA, Reed JD (2003) Matrix assisted laser desorption/ionization time of high mass spectrometry of heteropolyflavan- 3-ols and glucosylated heteropolyflavans in Sorghum (Sorghum bicolor (L.) Moench). J Agric Food Chem 51: 538-543.
- Eswara Reddy NP, Jacobs M (2002) Sorghum lysine-rich cultivar verification by SDS-PAGE and Southern blot. Acta Physiologiae Plantarum 24: 285-290.
- Gorg A, Postel W, Gunther S (1988) The current state of two-dimensional electrophoresis with immobilized pH gradients. J Electrophoresis 9: 531-546.
- Klose J, Kobalz U (1995) Two-dimensional electrophoresis of proteins: An updated protocol and implications for a functional analysis of the genome. J Electrophoresis 16: 1034-1059.
- Chivasa S, Ndimba BK, Simon WJ, Robertson D, Yu XL, et al. (2002) Proteomic analysis of the Arabidopsis thaliana cell wall. Electrophoresis 23: 1754-1765.
- Ndimba BK, Chivasa S, Simon WJ, Slabas AR (2005) Identification of Arabidopsis salt and osmotic stress responsive proteins using two-dimensional difference gel electrophoresis and mass spectrometry. Proteomics 5: 4185-4196.
- Oh MW, Roy SK, Kamal AH, Cho K, Cho SW, et al. (2014) Proteome analysis of roots of wheat seedlings under aluminum stress. Mol Biol Rep 41: 671-681.
- Bolon YT, Joseph B, Cannon SB, Graham MA, Diers BW, et al. (2010) Complementary genetic and genomic approaches help characterize the linkage group I seed protein QTL in soybean. BMC Plant Biol 10: 41.
- Hurkman WJ, Vensel WH, Tanaka CK, Whitehand L, Altenbach SB (2009) Effect of high temperature an albumimn and globulin accumulation in the endosperm proteome of the developing wheat grain. J Cereal Sci 49: 12-23.
- Vensel WH, Tanaka CK, Cai N, Wong JH, Buchanan BB, et al. (2005) Developmental changes in the metabolic protein profile of wheat endosperm. Proteomics 5: 1594-1611.
- Wang W, Vignani R, Scali M, Cresti M (2006) A universal and rapid protocol for protein extraction from recalcitrant plant tissues for proteomic analysis. Electrophoresis 27: 2782-2786.
- Hurkman WJ, Tanaka CK (2007) High-resolution two-dimensional gel electrophoresis: a cornerstone for plant proteomics. In J Samaj and JJ Thelen (Eds.), Plant proteomics 14-28.
- Carpentier SC, Witters E, Laukens K, Deckers P, Swennen R, et al. (2005) Preparation of protein extracts from recalcitrant plant tissues: an evaluation of different methods for two-dimensional gel electrophoresis analysis. Proteomics 5: 2497-2507.
- Gorg A, Weiss W, Dunn MJ (2004) Current two-dimensional electrophoresis technology for proteomics. Proteomics 4: 3665-3685.
- Valerie M, Thierry B, Sophie C, Marlene DOL, Luc N, et al. (2004) A two-dimensional proteome map of maize endosperm. Phytochemistry 65: 1609-1618.
- Natarajan SS, Xu C, Bae H, Caperna TJ, Garrett WM (2006) Characterization of storage proteins in wild (Glycine soja) and cultivated (Glycine max) soybean seeds using proteomic analysis. J Agric Food Chem 54: 3114-3120.
- Xu F, Moura JL, Capelo L (2010) Facile trypsin immobilization in polymeric membranes for rapid, efficient protein digestion. Analy Chem 50: 1105-1109.
- Westermeier R (2006) Preparation of plant samples for 2-D electrophoresis. Proteomics 2: 56-60.
- Taylor JR, Taylor JRN (2002) Alleviation of the adverse effect of cooking on Sorghum protein digestibility through fermentation in traditional African porridges. International Journal of Food Science and Technology 37: 129-137.
- Taylor JRN (2004) Grain production and consumption: Africa. In: Wrigley C, Corke H, Walker CE (Eds.), Encyclopedia of Grain Science. Elsevier, London, 70-78.

