Keywords
Thalassemia major; Artificial neural networks; Osteoporosis; Bone microarchitecture
Introduction
Thalassemic syndromes are hereditary diseases characterized by abnormal hemoglobin synthesis and ineffective erythropoiesis [1-4]. Optimal transfusion protocols and new chelating drugs have substantially improved the survival expectations of the patients with thalassemia major (TM), a transfusion-dependent form, who often died at pediatric ages until the ‘80s. On the other hand, the progressive aging of the TM population has disclosed new complications related to the chronicity of the disease; among them, a common bone disease (osteopenia/osteoporosis syndrome) with increased fracture risk, high social costs and low quality of life. Therefore, improvement in standards of care of bone involvement is a leading challenge in this disease.
The fracture risk evaluation based on BMD is considered the diagnostic gold standard despite the recognized low sensitivity, as demonstrated by the occurrence of fractures not only in subjects with osteoporosis but also with osteopenia [5]. This was ascribed to further factors accounting for bone strength in addition to BMD; among them are features included in the concept of bone quality [6], such as micro-architecture and geometry.
Micro-architecture is best assessed directly via histomorphometry of the transiliac crest bone biopsy, which does not necessarily reflect microstructure at spine and femur, where fragility fractures occur [7]. However, this direct method is invasive and nowadays not suitable for routine diagnostic procedure.
Many other indirect methods are available to assess bone micro-architecture, based on X-Ray methods: conventional X-Ray radiography, magnification radiography, high-resolution computed tomography (HRCT), high-resolution magnetic resonance imaging (HRMRI) [8-10].
Bone texture analysis methods, such as “fractals” represent a particularly interesting tool to indirectly assess the real spatial bone architecture [11]. However, these techniques remain unsuited for both routine screening and clinical management of osteoporosis, due to high costs, patient inconvenience, and limited availability. Furthermore, to perform the cited X-Ray methods the patients have to undergo to an additional diagnostic dedicated text, besides DXA.
One of latest DXA development, contextual to the DXA text, is TBS, a new gray-level textural measure directly extracted from the 2-dimensional DXA image of the lumbar spine, which expresses the trabecular microstructure [12,13]. Elevated TBS closely correlates with better skeletal texture (reflecting healthier microarchitecture), while a low value is connected with weaker texture (damaged microarchitecture) [12-17]. Recent studies have proved that TBS may be a useful adjunct to BMD in order to predict fragility fractures in primary osteoporosis [13,18], and it provides the promise of potential utility in secondary osteoporosis [19].
The concept of bone quality also includes hip geometry, which has been independently associated with hip fracture risk [20]; this can be explained as the loading forces are spread in cross sections on bone. HSA is a specific program which derives the cross sectional geometry from images acquired by the bone mineral scanner. Scientific studies suggested that the combined assessment of BMD and geometrical structure may represent a helpful approach to estimate bone strength and fracture risk in primary and secondary osteoporosis [20-26].
In a previous study we applied TBS to TM patients and demonstrated the impairment of both bone mineralization and microarchitecture [27]; in contrast, no published data are available regarding geometrical aspects in thalassemia. Both bone quantity and bone quality are influenced by several clinical features of this multifaceted disease, where multiple factors of endocrine-metabolic, genetic, and environmental nature interact through nonlinear biological mechanisms.
We hypothesized that a specialized mathematical approach such as artificial neural networks (ANNs) may be valuable to expand understanding of these complex interactions. ANNs are artificial systems that modify their internal structure in relation to a function objective: they can learn by extracting the information needed from the accessible data, and generalize to accomplish a specific task. Thanks to their ability to acquire knowledge in this adaptive way, the ANNs present as a powerful tool for data analysis in non-linear biological interactions [28,29]. The semantic connectivity map is a data mining approach maintaining the links among variables, and enabling the detection of hidden trends and associations. It has been demonstrated that this method might be the future of data analysis in many areas of medicine, as it can improve the predictive value of classic statistics [28-32].
The aim of this study was to apply the ANNs to the thalassemic osteopathy, in order to obtain a greater insight with a comprehensive analysis taking in account all the parameters measuring bone quantity and bone quality, and their connections with the other features of the disease.
Methods & Patients
Seventy-six patients with thalassemia major followed-up at our tertiary outpatient clinic in Milan underwent an extensive evaluation of the bone condition using DXA, including bone mineral density assessment, calculation of the TBS as an index of microarchitecture, and analysis of the femoral geometry. In the context of routine checks for these patients, an annual endocrinological evaluation was conducted, which included a clinical examination, assessment of bone metabolism indices, and tests for thyroid, parathyroid, adrenal, gonadic, and pancreatic function; the clinical, hematological and endocrinological data contemporary to the densitometric evaluation were extracted from the clinical charts. Furthermore, information was collected regarding age, gender, body mass index (BMI), history of fractures, height and sexual development, splenectomy, liver function and disease, drugs, initiation age of transfusions, and the mean values of pre-transfusional hemoglobin and ferritin in the previous year. The compliance to chelation was estimated on the basis of the mean ferritin levels evaluated every 3 months, and the liver iron content (LIC) was determined via MRI, when available.
In all patients, the endocrine deficiencies had been appropriately replaced with sex steroids, levothyroxine, calcium and calcitriol as indicated.
The approval of the ethical committee of our institution (number 2013-841) and patient informed consent were obtained.
Methods
A blood cell count was performed using a Coulter Counter. Automated routine procedures were implemented for the liver function tests and assays of intact parathyroid hormone (n.v.: 1.5-6.6 pmol/L), osteocalcin (n.v.: females 5.3-23.6, mcg/L; males, 4.4-26.1), 25-hydroxy vitamin D (n.v.: >72 nmol/L), ferritin (n.v.: 30-400 mcg/L), glucose (n.v. 70-110 mg%), insulin (n.v. 2.6-25 mU/L), TSH (ECLIA, n.v. 0.3-4.2 mU/L), and calcium and phosphorus in serum (normal values, n.v.: 2.1-2.5 and 0.8-1.4 mmol/L, respectively) and urine (n.v.: 2.5-7.5 and 12.9-42 mmol/ day, respectively). The serum calcium levels were not corrected for albumin because the latter was normal in all patients.
Alkaline phosphatase was measured using the International Federation of Clinical Chemistry liquid (n.v.: 40-129 U/L); the bone isoenzyme was assessed via a semi-quantitative electrophoretic method using a scanning densitometer (normal values, 20-75%). The serum CTX was assayed via a Serum CrossLaps One Step ELISA (IDS, Boldon, Tyne and Wear, UK; n.v.: women, postmenopausal, 0.142-1.351; premenopausal, 0.112-0.73; males 0.115-0.748 ng/mL).
Iron overload was estimated by the LIC, which was derived from T2* according to Wood et al [33,34] using the following formula: [LIC (mg/g/dw) = [(1/ (T2*/1000)] x 0,0254+0,202].
MRI was performed at the CMR Unit Department of Cardiology “A. De Gasperis” at Niguarda Ca’ Granda Hospital in Milan, using a 1.5 Tesla MR scanner (Avanto Siemens, Erlangen). The T2* images were analyzed using post-processing software (CMR Tools, Imperial College, London).
Bone quantity and quality assessment
Dual X-ray photon absorptiometry (Hologic Bone Densitometer, QDR Discovery A, Version 13.3:3, Waltman, MA, USA) was used to measure the bone mineral content (BMC, g) and BMD (BMC/area expressed in cm2) of the lumbar spine from L1 to L4, as well as the proximal femoral epiphysis at the neck and total femur. Bone mineral density was (BMD) expressed as absolute value. Lumbar spine TBS was derived from spine DXA using TBS iNsight® software (medimaps SASU, Merignac, France). The evaluator was blinded to the clinical parameters and outcome of the subjects.
The hip structural analysis (HSA) was automatically calculated from the femoral scan. The following main structural parameters were extracted: the surface area of the bone in the cross section (cross sectional area, CSA, cm2), the cross sectional moment of inertia (CSMI, cm4), the section modulus (Z, cm3), and the buckling ratio (BR) at the narrow neck, the intertrochanter and the femoral shaft. The CSA is an index of bone resistance to the axially directed compressive loads. The CSMI is an index of structural rigidity which reflects the flexural strength. Z is computed from the CSMI, which weights the area in the cross section by the square of its distance from the centroid. The CSA and Z are inversely related to the maximum stresses that result from axial and bending loads, respectively [23,24]. The buckling ratio (BR) is calculated as the maximum distance between the center of the mass and the outer cortex over the average cortical thickness; it provides an index of stability of the cortex under compressive loads.
Artificial network analysis
The relations between all the studied parameters were investigated by the artificial neural network analysis (ANN). This is an adaptive mathematical model widely applied to study various pathological conditions, as particularly suitable for analyzing non-linear interactions between many variables [30,32,35-39]. Unlike standard statistical tests, ANNs is also a valid tool to analyze small sized samples, with imbalance between variables and records [38,39].
A mapping method [28,29] was used to graphically highlight the most important links among variables, using the Auto Contractive Map algorithm (auto-CM), which is a special kind of ANN able to define the strength of association between each variable and all others in any dataset. Auto-CM allows to find the consistent patterns and/or systematic relationships, the hidden trends and the associations and to generate a graph (i.e., a connectivity map) that represents visually the main connections among the entered variables. This network, after a learning phase in which all the variables are dynamically interconnected, builds-up a weight matrix in which the weights are proportional to the strength of associations between the variables. The weights are then transformed in physical distances. The couples of variables for which the connection weights are higher appear nearer in the semantic map, and vice versa. A simple mathematical filter represented by a minimal spanning tree (MST) is applied to the distance matrix, and a graph is generated. This step allows the observation of the schemes of connections among the variables and the detection of variables acting as “hubs”, being highly connected. As detailed by Buscema and Grossi [28,29], this matrix of connections preserves nonlinear associations among the variables and captures the scheme of connections among clusters. From an experimental point of view, the ranking of its connections matrix is equal to the ranking of the joint probability between each variable and the others. Each continuous variable for which a paradigmatic cut-off value was not available was transformed into two complementary variables. For this purpose this variables values were scaled from 0 to 1, and a complementary variable was obtained subtracting the scaled actual values from 1. Therefore, two classes are formed for each variable: a class highlights the values in the high range, and a class highlights those in the lower range. In the map these two complementary forms were named as high and low. This pre-processing scaling is necessary to make a proportional comparison among all the possible variables, and to understand the links of each variable when the values tend to be high or low. This information is important, because in the nonlinear systems the position of high and low values of a given variable is not necessarily symmetric.
Maximally Regular Graph (MRG) was used to evaluate the relations between variables. MRG shows the maximum intrinsic complexity of the map by including the highest number of cyclic regular microstructures between the variables, as described elsewhere [29].
A mapping method [28,29] was used to graphically highlight the most important links among the variables, using the Auto Contractive Map algorithm, which is a special type of ANN that identifies the consistent patterns and/or systematic relationships, the hidden trends and the associations among variables [29]. After the training phase, the weights developed by the Auto Contractive Map are proportional to the strength of the associations between the variables. The weights are subsequently transformed in physical distances. Variable couples for which the connection weights are higher become nearer in the semantic map, and vice versa. A simple mathematical filter represented by a minimal spanning tree is applied to the distance matrix, and a graph is generated. This step enables the observation of connection schemes among the variables and the identification of variables that act as “hubs”, which are highly connected. This matrix of connections, as detailed by Buscema and Grossi [28,29] preserves the nonlinear associations among variables and captures the connection schemes among clusters.
Results
The study group included 76 adult Caucasian patients homozygous or double heterozygous for severe betathalassemia mutations; there were 28 males and 48 females, with a mean age 35.9 ± 6.5 years and a range of 22-54. The patients were on a regular transfusion regimen every 20-25 days to maintain the pre-transfusional hemoglobin at approximately 9-9.5 g/dL, according to the international guidelines [40]. Moreover, all patients were treated with iron chelating therapy: 21 patients (27.6%) with deferoxamine (30 ± 5 mg/Kg), 4 patients (5.2%) with deferiprone (75 mg/Kg), and 40 patients (52.6%) with deferasirox (20 ± 5 mg/Kg), 8 patients (10.5%) with deferoxamine + deferiprone, and 2 patients (1.3%) with deferoxamine + deferasirox.
The hematologic variables were as follows: pre-transfusional Hb (9.56 ± 0.63, range 8.5-11 g/dL), ferritin (median 697, range 104 - 5631 mcg/L), fibroscan (9.7 ± 3.7, range 3.90- 19.80 kPa), T2* heart (31.18 ± 11.93, range 5.18-54.82 ms), T2* liver (8.27 ± 6.23, range 0.96-22.46 ms), and LIC (5.83 ± 5.14, range 0.94-22.68 mg Fe/g of liver dry weight). Forty-five patients (59.2%) were anti-HCV positive and 28 patients (36.8%) were HCV RNA positive; 42 patients (55.2%) had been splenectomized.
Fifty patients (67%) were taking cholecalciferol supplements for vitamin D deficiency, which produced 25OH-vitamin D concentrations from 20 to 30 ng/ml; 6 patients (7.8%) were also on antiresorptive treatment with bisphosphonates. The 55 hypogonadic patients (72.3%) were on adequate sex steroid replacement.
Based on the bone mineralization at DXA, the patients were classified as follows: 35 patients (46%) with osteoporosis, 40 patients (52.6%) with osteopenia, and 1 patient (1.3%) with normal mineralization. The BMD, TBS and HSA values are reported in Tables 1 and 2, respectively.
| |
Lumbar spine |
Total femur |
Femur neck |
| T-score |
Z-score |
BMD* |
T-score |
Z-score |
BMD* |
T-score |
Z-score |
BMD* |
| Mean |
-2,34 |
-2,22 |
0,80 |
-1,82 |
-1,76 |
0,72 |
-1,83 |
-1,60 |
0,66 |
| SD |
0,99 |
1,01 |
0,12 |
0,97 |
0,85 |
0,13 |
0,89 |
0,88 |
0,11 |
*BMD = Bone Mineral Density
Table 1: Bone mineral density parameters in patients with Thalassemia Major.
| Parameter |
Mean |
Standard deviation |
| TBS |
1,033 |
0,125 |
| HSA-CSA |
NN |
2,372 |
0,646 |
| IT |
4,251 |
1,185 |
| FS |
3,100 |
0,824 |
| HSA-CSMI |
NN |
2,001 |
0,882 |
| IT |
12,825 |
5,303 |
| FS |
2,548 |
0,966 |
| HSA-Z |
NN |
1,089 |
0,468 |
| IT |
3,685 |
1,271 |
| FS |
1,701 |
0,547 |
| HSA-BR |
NN |
13,210 |
5,341 |
| IT |
9,720 |
3,003 |
| FS |
3,633 |
1,289 |
TBS: Trabecular Bone Score; CSA: Cross Sectional Area; CSMI: Cross Sectional Moment of Inertia; HSA-Z: Section Modulus; HAS-BR: Buckling Ratio.
Trabecular Bone Score expresses bone microarchitecture; CSA, CSMI, Z-modulus, and BR are related to the hip geometry.
Table 2: Bone quality parameters in patients with thalassemia major.
Twelve patients (15.7%) had previously reported bone fractures at both central and peripheral sites, considering only the events produced by not efficient traumas.
The connectivity maps (Figures 1-3) show the connections between the low and high values of all variables linked to bone mineralization and the variables linked to the thalassemic condition, including the iron status and endocrinological complications.
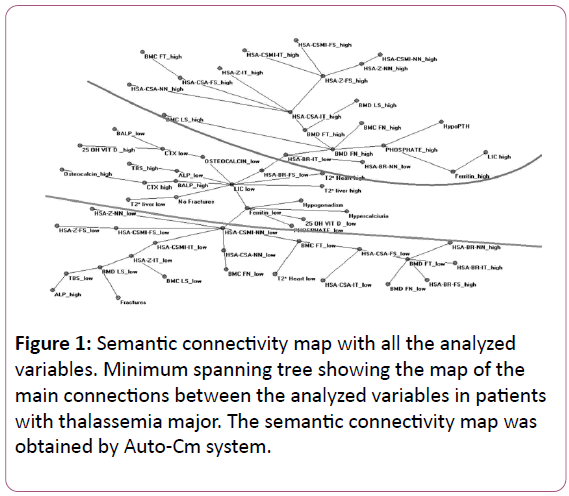
Figure 1: Semantic connectivity map with all the analyzed variables. Minimum spanning tree showing the map of the main connections between the analyzed variables in patients with thalassemia major. The semantic connectivity map was obtained by Auto-Cm system.
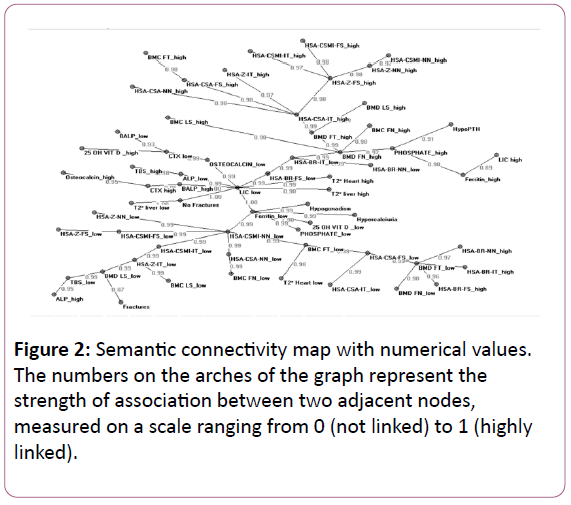
Figure 2: Semantic connectivity map with numerical values. The numbers on the arches of the graph represent the strength of association between two adjacent nodes, measured on a scale ranging from 0 (not linked) to 1 (highly linked).
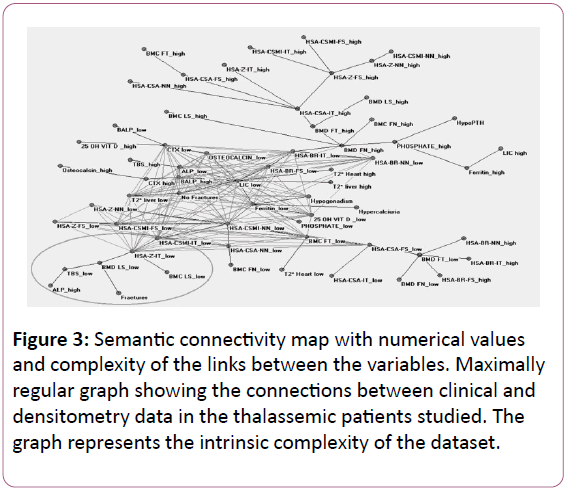
Figure 3: Semantic connectivity map with numerical values and complexity of the links between the variables. Maximally regular graph showing the connections between clinical and densitometry data in the thalassemic patients studied. The graph represents the intrinsic complexity of the dataset.
Compared with Figure 1, Figure 2 also shows the link strength, and Figure 3 indicates the complexity of the links between the variables.
At an overall examination of the maps, two “hubs” that connect many variables emerge, more precisely, LIC and ferritin, both indicative of the iron status. In addition to appearing as the main variables of the whole system, these hubs divide the map into two main sectors: most parameters that indicate satisfactory bone quantity and quality are grouped in the upper part of the map, whereas the lower area contains the parameters that express a poor bone condition and fractures. Following a more detailed examination, the cluster in the upper section includes several variables that characterize a better bone status, namely, a high BMD and high values of the hip structural analysis variables (high HSA-CSA, CSMI, and Z modulus and low BR).
In contrast, low values of the TBS (which characterize poor bone quality) and of the femur geometric parameters expressing the resistance to compressive and bending forces (CSMI, CSA, Z modulus, and high BR) are assembled in the lower section of the map in proximity to the variable “fractures”.
In contrast to the key role of the liver iron concentration in the whole system, the other variables expressing iron overload (T2* of the liver and heart) appear in a peripheral position, similarly to the variables indicating endocrinopathies, poorly connected with the other parameters examined.
Also vitamin D levels lack noticeable links with other parameters; moreover, they appear to be irrelevant to bone condition, considering that both high and low levels are included in the same section of the map.
Discussion
Our population included hemoglobinopathic and iron overloaded patients with endocrinopathy and osteopathy. As a result of the complex interplay of multiple variables that indicate the bone condition, clinical, and endocrinological status, a multifaceted system is generated in thalassemia. In this setting, classic statistics do not enable a comprehensive explanation of the relationships between the variables of interest because the substantial number of measures involved appears to weaken the power of analysis. A special mathematical approach, such as artificial neuronal network (ANNs), may be useful to further understand hidden nonlinear biological mechanisms.
ANNs are artificial computerized algorithms, inspired by the neuronal connections of the human brain, which enable the investigation of biological phenomena through a complex nonlinear association analysis. These networks are based on the nodes and connections of the considered variables. Each node receives input data from other nodes or the environment, and it sends output data to other nodes or the environment, as well through positive/excitatory or negative/inhibitory connections, similar to a neural network. The connections are not permanent, but can change over time under the influence of varying input data. This behavior is described as the “law of learning”, meaning that ANNs may be influenced by the environment and thereby modify the inner connections, similar to the brain. This experimental knowledge, which recreates the fuzzy logic rules [28,29] appears to be particularly suited for solving nonlinear problems and providing the optimal answers. Another reason for the interest of ANNs is their ability to provide an accurate analysis even with measurement errors or incorrect data, having a so called “noise tolerance”.
Using this innovative approach in thalassemic patients, their bone problems were examined from an original perspective, and we believe that the present study has obtained results of particular interest.
The ANN analysis was performed by considering both the low and high levels of each variable; the resulting semantic map enabled discrimination of the patients with a poor bone condition, who were at high risk of fracture, from the patients spared by fracture complications. The examined variables were distributed into two main map sectors: the optimal values of the parameters that indicate bone quantity and bone geometry were allocated in the upper sector, whereas the parameters that indicate a worse condition, in terms of bone microarchitecture and bone geometry, were grouped in the lower sector, which is the same location where the fragility fractures were placed. As specified in the Results section, we considered all fragility fractures reported by the patients, both peripheral and central, excluding those following an efficient trauma (e.g., road accidents) [40].
In an examination of the bone quantity markers provided by DXA, a high femoral BMD appeared to be an important hub connected with satisfactory bone status (including both microarchitectural and geometrical bone indices). In other terms, the bone femoral densitometry data appear to be a variable of paramount importance in evaluating the bone condition, which confirms the widely accepted statement that bone mineral density (BMD) is a major determinant of bone strength and fracture risk [41]. Actually, based on this belief, the BMD has been largely adopted in clinical practice to define the degree of bone loss in beta-thalassemia, as well as the primary and secondary forms of osteoporosis [42,43].
However, the greatest and well recognized limitation of bone quantity measurement is the considerable overlap of BMD values in patients with and without fractures [44]; this behavior was ascribed to the contribution of multiple structural determinants to bone strength that are enclosed in the general concept of “bone quality”, including bone microarchitecture and bone geometry [45-54].
Actually, in our connectivity maps, all variables indicating both high bone quantity and satisfactory bone quality were interconnected and grouped in the upper portion of the map; thus, they were farthest away from the variable “fractures”, which was located in the extremely low section. The ANNs are not suitable for the evaluation of the prognostic value of parameters; however, this distribution may suggest that patients with good bone quantity and quality are not at an increased risk of fractures, although they are thalassemic.
In this respect, the ANNs confirm the key role of the conjunct assessment of both bone quantity and bone quality described by previous studies using classic statistics [55]; in addition, among the multiple indices of bone quantity and bone quality available for the evaluation, the ANNs highlight the focal importance of high femoral BMD in the identification of a satisfactory bone state.
An additional variable exerting a pivotal role in our map was the CSMI, which is an index of femoral structural rigidity; in effect, the variable “low CSMI” was interconnected with several parameters indicating poor bone status, inclusive of bone quantity, bone geometry, and bone microarchitecture.
Moreover, the variable fractures were located in the same section of the map, i.e., the lower section, to indicate the association between fracture events and poor bone quantity and quality.
There were only a limited number of interconnections and variables located in the lower portion of the semantic map; however, it is evident that the way leading to the fractures passes through low TBS and low HSA-Z, which indicate damaged microarchitecture and impaired geometry, respectively.
The present results of the ANN analysis confirm our previous findings, which were obtained by classic statistical analysis, of poor bone microarchitecture in patients with thalassemia major [27].
As regards the hip structural analysis, a comparison with other studies cannot be performed, being the present the first report of bone geometry evaluation in thalassemic patients.
Among the iron status variables included in the ANNs analysis, low LIC and low ferritin presented as the main nodes in the map connecting bone turnover parameters, endocrinological indices, and the variable “no fractures”. Furthermore, a low LIC was directly connected with low turnover indices and high TBS, which indicates good bone microstructure. This arrangement underlines the central role of iron status evaluation in thalassemic patients, which is warranted by the close link between iron overload and the development of several complications, and confirms a well-known and well described concept [55-57].
It is remarkable that among four parameters that indicate the iron status (LIC, ferritin, heart and liver T2*), the LIC and ferritin have emerged as playing the main connecting role in our semantic map. The LIC value included in the analysis was derived from liver T2* through the Wood formula [33]; thus, we would have expected that the two variables shared the same connections. This likely did not occur because the liver T2* values are expressed in a logarithmic scale.
Endocrine disease and vitamin D status did not appear to significantly influence the bone condition, as indicated by their absolutely peripheral position and the contemporary presence of both high and low levels of vitamin D in the same sector of the map. In effect, the role of the vitamin D status in thalassemic osteopathy is controversial, and previous studies from our and other groups did not identify correlations between 25OH vitamin D serum levels, bone microarchitecture index (TBS), PTH, and calcium [27]. In contrast, it is more difficult to explain the lack of importance of endocrine parameters in our analysis; however, it may be hypothesized that they play a minor role compared with the variables that indicate bone quantity and quality in the evaluation of fracture risk.
In conclusion, based on a comprehensive neural network analysis that included multiple clinical, biochemical, and instrumental parameters, bone geometry and microarchitecture evaluation using DXA has emerged as an important tool in the assessment of thalassemic osteopathy. A complete evaluation by densitometry may be considered the gold standard to classify the patients for prognostic and therapeutic purposes.
Conflict of Interest
MDC is member of the advisory board for Novartis, Celgene, and Genzyme/Sanofi. The other authors have nothing to declare.
The study was partially funded by grants of Ministero della Salute (RC 2016). The authors confirm independence from the sponsor; the content of the article has not been influenced by the sponsor.
All the Authors have participated to the study and have approved the final article.
Study Design and Conduct
MB, FMU, AM, EC and MDC.
DXA, TBS and HSA imaging: FMU, MC.
Endocrinological and bone turnover tests: MB.
Analysis and interpretation of data: EG.
Drafting the manuscript: MB, FMU and MDC.
Data interpretation, manuscript revision and approval of the final version: all authors.
Ethical Approval
The study was conducted in accordance with the Declaration of Helsinki. The approval of the ethical committee of our institution (number 2013-841) was obtained.
Informed Consent
All patients provided written informed consent to participate.
Acknowledgement
We thank Dr Alberto Roghi and Patrizia Pedrotti, CMR Unit, Department of Cardiology and Cardiovascular Surgery, Niguarda Ca’ Granda Hospital, Milan, for performing CMR T2*. We thank Cass Ingerson for editing the manuscript.
References
- Borgna-Pignatti C (2010) The life of patients with thalassemia major. Haematologica 95: 345-348.
- Angelucci EI, Barosi G, Cappellini MD, Cazzola M, Galanello R, et al. (2008) Italian Society of Hematology practice guidelines for the management of iron overload in thalassemia major and related disorders. Haematologica93:741-752.
- Angastiniotis M, Eleftheriou A (208)Thalassaemic bone disease. An overview. PediatrEndocrinol Rev 6: 73-80.
- Haidar R, Musallam KM, Taher AT (2011) Bone disease and skeletal complications in patients with β thalassemia major. Bone 48:425-432.
- Hordon LD, Raisi M, Aaron JE, Paxton SK, Beneton M, et al. (2000) Trabecular architecture in women and men of similar bone mass with and without vertebral fracture: I. Two-dimensional histology. Bone 27: 271-276.
- Link TM, Majumdar S (2004) Current diagnostic techniques in the evaluation of bone architecture. CurrOsteoporos Rep 2: 47-52.
- Boehm HF, Vogel T, Panteleon A, Burklein D, Bitterling H, et al. (2007) Differentiation between post-menopausal women with and without hip fractures: enhanced evaluation of clinical DXA by topological analysis of the mineral distribution in the scan images. OsteoporosInt18:779-787.
- Link TM,Majumdar S,Grampp S,Guglielmi G,van Kuijk C, et al. (1999) Imaging of trabecular bone structure in osteoporosis. EurRadiol 9:1781-1788.
- Keni Z,Makrogiannis S (2016) Bone texture characterization for osteoporosis diagnosis using digital radiography. ConfProc IEEE Eng Med BiolSoc 2016:1034-1037.
- Zaia A (2015) Fractal lacunarity of trabecular bone and magnetic resonance imaging: New perspectives for osteoporotic fracture risk assessment. World J Orthop 6: 221-235.
- Harrar K, Jennane R, Zaouchi K, Janvier T, Toumi H, et al. (2018) Oriented fractal analysis for improved bone microarchitecture characterization. Biomedical Signal Processing and Control 39: 474-485.
- Hans D, Barthe N, Boutroy S, Pothuaud L, Winzenrieth R, et al. (2011) Correlations between trabecular bone score, measured using anteroposterior dual-energy X-ray absorptiometry acquisition, and 3-dimensional parameters of bone microarchitecture: an experimental study on human cadaver vertebrae. J ClinDensitom14:302-312.
- Silva BC, Leslie WD, Resch H, Lamy O, Lesnyak O, et al. (2014) Trabecular bone score: a noninvasive analytical method based upon the DXA image. J Bone Miner Res 29: 518-530.
- Pothuaud L, Carceller P, Hans D (2008) Correlations between grey-level variations in 2D projection images (TBS) and 3D microarchitecture: applications in the study of human trabecular bone microarchitecture. Bone 42:775-787.
- Muschitz C, Kocijan R, Haschka J, Pahr D, Kaider A, et al. (2015) TBS reflects trabecular microarchitecture in premenopausal women and men with idiopathic osteoporosis and low-traumatic fractures. Bone 79:259-266.
- Winzenrieth R, Michelet F, Hans D (2012) Three-dimensional (3D) microarchitecture correlations with 2D projection image gray-level variations assessed by trabecular bone score using high-resolution computed tomographic acquisitions: effects of resolution and noise. J ClinDensitom16:287-296.
- Roux JP (2013)Wegrzyn J, Boutroy S, Bouxsein ML, Hans D, Chapurlat R. The predictive value of trabecular bone score (TBS) on whole lumbar vertebrae mechanics: an ex vivo study. OsteoporosInt24:2455-2460.
- Silva BC, Broy SB, Boutroy S, Schousboe JT, Shepherd JA, et al. (2015) Fracture Risk Prediction by Non-BMD DXA Measures: the 2015 ISCD Official Positions Part 2: Trabecular Bone Score. J ClinDensitom18:309-330.
- Ulivieri FM, Silva BC, Sardanelli F, Hans D, Bilezikian JP, et al. (2014) Utility of the trabecular bone score (TBS) in secondary osteoporosis. Endocrine 47:435-448.
- Crabtree NJ, Kroger H, Martin A, Pol HAP, Lorenc R, et al. (2002) Improving risk assessment: hip geometry, bone mineral distribution and bone strength in hip fracture cases and controls. The EPOS study, European Prospective Osteoporosis Study. OsteoporosInt 13: 48-54.
- Beck TJ, Ruff CB, Warden KE, Scott WW, Rao GU (1990) Predicting femoral neck strength from bone mineral data. A structural approach. Invest Radiol 25: 6-18.
- Martin RB, Burr DB (1984) Non-invasive measurement of long bone cross-sectional moment of inertia by photon absorptiometry. J Biomech17: 195-201.
- Danielson ME, Beck T, Karlamangla AS, Greendale GA, Atkinson EJ, et al. (2013) A comparison of DXA and CT based methods for estimating the strength of the femoral neck in post-menopausal women. OsteoporosInt24:1379-1388.
- Kaptoge S, Dalzell N, Loveridge N, Beck TJ, Khaw K-T, et al. (2003) Effects of gender, anthropometric variables, and aging on the evolution of hip strength in men and women aged over 65. Bone 32: 561-570.
- Uusi-Rasi K, Semanick LM, Zanchetta JR, Bogado CE, Eriksen EF, et al. (2005) Effects of teriparatide [rhPTH (1-34)] treatment on structural geometry of the proximal femur in elderly osteoporotic women. Bone 36:948-958.
- Uusi-Rasi K, Beck TJ, Semanick LM, Daphtary MM, Crans GG, et al. (2006) Structural effects of raloxifene on the proximal femur: results from the multiple outcomes of raloxifene evaluation trial. OsteoporosInt17:575-586.
- Baldini M, Ulivieri FM, Forti S, Serafino S, Seghezzi S, et al. (2014) Spine bone texture assessed by trabecular bone score (TBS) to evaluate bone health in thalassemia major. Calcif Tissue Int95:540-546.
- Buscema M, Grossi E (2008) The semantic connectivity map: an adapting self-organising knowledge discovery method in data bases. Experience in gastro-oesophageal reflux disease. Int J Data Min Bioinform 2: 362-404.
- Buscema M,Grossi E, Snowdon D, Antuono P (2008) Auto-Contractive Maps: an artificial adaptive system for data mining. An application to Alzheimer disease. Curr Alzheimer Res 5: 481-498.
- Licastro F, Porcellini E, Chiappelli M, Forti P, Buscema M, et al. (2010) Multivariable network associated with cognitive decline and dementia. Neurobiol Aging 31: 257-269.
- Grossi E, Cazzaniga S, Crotti S, Naldi L, Di Landro A, et al. (2014) The constellation of dietary factors in adolescent acne: a semantic connectivity map approach. J EurAcadDermatolVenereol30: 96-100.
- Gironi M, Borgiani B, Farina E, Mariani E, Cursano C, et al. (2015) A global immune deficit in Alzheimer’s disease and mild cognitive impairment disclosed by a novel data mining process. J Alzheimer Dis 43: 1199-1213.
- Wood JC, Enriquez C, Ghugre N, Tyzka JM, Carson S, et al. (2005) MRI R2 and R2* mapping accurately estimates hepatic iron concentration in transfusion-dependent thalassemia and sickle cell disease patients. Blood 106:1460-1465.
- Ramamurthi K, Ahmad O, Engelke K, Taylor RH, Zhu K, et al. (2012) An in vivo comparison of hip structure analysis (HSA) with measurements obtained by QCT. OsteoporoInt23:543-551.
- Eller-Vainicher C, Chiodini I, Santi I, Massarotti, Pietrogrande L, et al. (2011) Recognition of morphometric vertebral fractures by artificial neural networks: analysis from GYSMO Lombardia database. Plosone6:e27277.
- Eller-Vainicher C, Zhukouskaya VV, Tolkachev YV, Koritko SS, Cairoli E, et al. (2011) Low bone mineral density and its predictors in type 1 diabetic patients evaluated by the classic statistics and artifical neural network analysis. Diabetes Care 34:2186-2191.
- Grossi E, Cazzaniga S, Crotti S, Naldi L, Di Landro A, et al. (2016) The constellation of dietary factors in adolescent acne: a semantic connectivity map approach. J EurAcadDermatolVenerol 30: 96-100.
- Rotondano G,Cipolletta L, Grossi E, Koch M, Intraligi M, et al. (2011) Italian registry on Upper Gastrointestinal Bleeding (ProgettoNazionaleEmorragie Digestive). Artificial neural networks accurately predict mortality in patients with nonvariceal upper GI bleeding. Gastrointestinal endosc 73: 218-226.
- Narzisi A, Muratori F, Buscema M, Calderoni S, Grossi E (2015)Oucome predictors in autism spectrum disorders preschoolers undegoing treatment as usual: insight from an observational Study using artificial neural networks. Neuropsychiatr Dis Treat 11: 1587-1599.
- Cappellini MD, Cohen A, Eleftheriou A, Piga A, Porter J, et al. (2008) Guidelines for the clinical management of thalassemia 2008, 2nd revised Edition. Thalassemia International Federation.
- Johnell O, Kanis JA, Oden A, Johansson H, De Laet C, et al. (2005) Predictive value of BMD for hip and other fractures. J Bone Miner Res 20: 1185-1194.
- WHO Study Group (1994) Assessment of fracture risk and its application to screening for postmenopausal osteoporosis. Report of a WHO Study Group, World Health Organ. Tech Rep Ser 843: 1-129.
- Angastiniotis M, Pavlides N, Aristidou K, Kanakas A, Yerakaris M, et al. (1998) Bone pain in thalassaemia: assessment of DEXA and MRI findings. J PediatrEndocrinolMetab11: 779-784.
- Cummings SR (1985) Are patients with hip fractures more osteoporotic? Review of the evidence. Am J Med 78: 487-494.
- NIH Consensus Development Panel on Osteoporosis Prevention, Diagnosis, and Therapy (2001) Osteoporosis prevention, diagnosis, and therapy. JAMA 285: 785-795.
- Rice JC, Cowin SC, Bowman JA (1988) On the dependence of the elasticity and strength of cancellous bone on apparent density. J Biomech 21: 155-168.
- Bagni B, Palazzi G, Bagni I, Caporali C, Froehlich W, et al. (1998)pQCT (quantitative peripheral tomography) and data evaluation of phosphocalcic metabolism in thalassaemic patients. J PediatrEndocrinolMetab 11: 791-794.
- Glüer CC, Jergas M, Hans D (1997) Peripheral measurement techniques for the assessment of osteoporosis. SeminNucl Med 27:229-247.
- Boonen S, Cheng X, Nicholson PH, Verbeke G, Broos P, et al. (1997) The accuracy of peripheral skeletal assessment at the radius in estimating femoral bone density as measured by dual-energy X-ray absorptiometry: a comparative study of single-photon absorptiometry and computed tomography. J Intern Med 242:323-328.
- Laib A, Hildebrand T, Häuselmann HJ, Rüegsegger P (1997) Ridge number density: a new parameter for in vivo bone structure analysis. Bone 21:541-546.
- Vokes TJ, Giger ML, Chinander MR, Karrison TG, Favus MJ, et al. (2006) Radiographic texture analysis of densitometer-generated calcaneus images differentiates postmenopausal women with and without fractures. OsteoporosInt17:1472-1482.
- Faulkner KG, Cummings SR, Black D, Palermo L, Glüer CC, et al. (1993) Simple measurement of femoral geometry predicts hip fracture: the study of osteoporotic fractures. J Bone Miner Res 8:1211-1217.
- Nakamura T, Turner CH, Yoshikawa T, Slemenda CW, Peacock M, et al. (1994) Do variations in hip geometry explain differences in hip fracture risk between Japanese and white Americans? J Bone Miner Res 9:1071-1076.
- Langton CM, Pisharody S, Keyak JH (2008) Comparison of 3D finite element analysis derived stiffness and BMD to determine the failure load of the excised proximal femur. Med EngPhys31:668-672.
- Hans D, Goertzen A, Krieg MA, Leslie WD (2011) Bone microarchitecture assessed by TBS predicts osteoporotic fractures independent of bone density: the Manitoba study. J Bone Miner Res 26: 2762-2769.
- Perisano C, Marzetti E, Spinelli MS, Callà CAM, Graci C, et al. (2012) Physiopathology of Bone Modifications in β-Thalassemia. Anemia.
- Delea TE, Edelsberg J, Sofrygin O, Thomas SK, Baladi JF, et al. (2007) Consequences and costs of noncompliance with iron chelation therapy in patients with transfusion-dependent thalassemia: a literature review. Transfusion 47: 1919-1929.