Keywords
Scattering, Particle, Suspension, Dilution, Concentration, Pharmaceutical, Potential
Introduction
Brownian motion is the principle behind dynamic light scattering and is very simple in its concept. In the case of a water based suspension, the water molecules (size 0.3 nm) collide with particles causing the particle to move with a certain velocity. The larger the particle the slower the velocity due to its greater mass and in fact when the particle is so large, that its velocity due to sedimentation is greater than the collision velocity due to Brownian motion determines the upper size limit to which DLS can measure particles. The lower end of measurement is determined by the size of the molecules colliding with the particles [1,2]. As the size of a water molecule is roughly 0.3 nm, it is obvious that the lower limit of detection is above this size. A depiction of the particles random movement is shown in Figure 1.
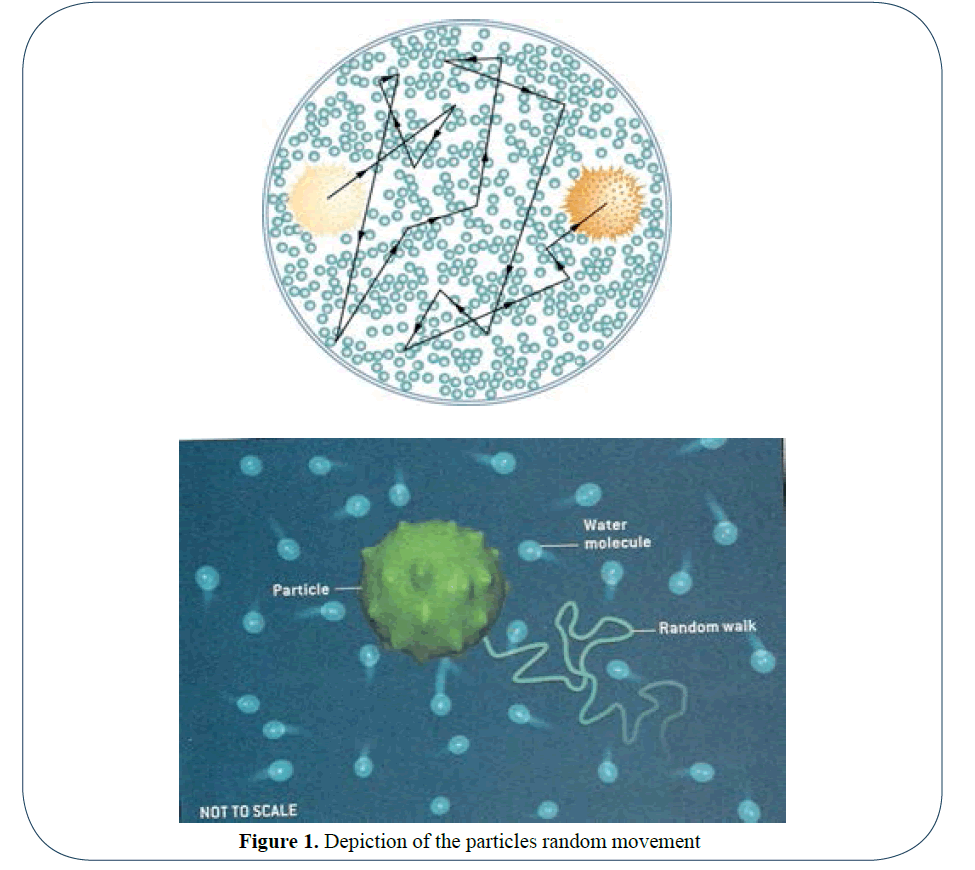
Figure 1: Depiction of the particles random movement
Historically two modes of optical measurement by DLS have commonly been used, self-beating (Homodyne) detection (1960s) and controlled reference or (Heterodyne) detection (1980s) [3]. Homodyne detection (PCS) involves monitoring the light scattering signals (photons) and analyzing by an autocorrelation function, whereas the Heterodyne method directly measures the frequency shift power spectrum (FPS) (Figure 2).
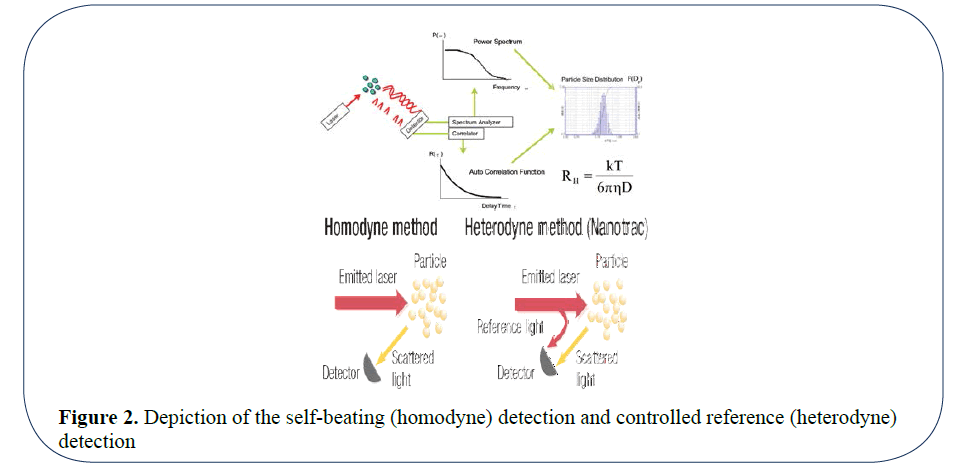
Figure 2: Depiction of the self-beating (homodyne) detection and controlled reference (heterodyne) detection
The optical arrangement in PCS systems have used Helium Neon lasers, correlators and Non Negative Least Squares (NNLS) software fitting routines to determine a result. The scattering capture angles were initially set at 90 degrees and later at lower and higher angles and the path length is 10 mm typically. The optical arrangement in Heterodyne FPS is entirely only measuring the backscattered light (180 degrees). The solid state laser diode is in intimate contact with the particles and measures the back scattering from particles up to 300 microns (0.3 mm) into the media and is directly collected by a detector a detector. As the path length is 30 times (10 mm compared to 0.3 mm) less on the Heterodyne FPS (Figure 3) method compared to the PCS method, we can measure much higher concentrations which allows us to measure fully concentrated product in the processes without any need to dilute and the problems that can ensue from dilution [1]. Because no dilution is required FPS paves the way to thus measure lab samples by placing the probe directly into the sample container. In addition, it can be integrated into fully automated at-line systems such as Chemspeed, which measures sample parameters at once without supervision. Online systems involve taking a bypass sample from a reactor vessel with probe inserted in the bypass, but ultimately the best way forward is to measure the suspension in-line directly in the reactor. As we are measuring the velocity of the particles to determine size, it is necessary that we only measure the Brownian motion and not any created motion from stirring or natural flow. For this reason, we have created a sheath to cover the probe. The end of the sheath will of course have liquid suspension moving around it, but a certain distance up the sheath there will be a point where there is no movement apart from that of Brownian motion. This is where the tip of the probe will be and this will allow us to measure undiluted suspensions in real time without dilution. The 180° DLS backscattering (Figure 4) is especially suitable for direct in-line use in reactors, because the handling of the measurement probe head with a diameter of 8 mm is just as easy as a pH head.
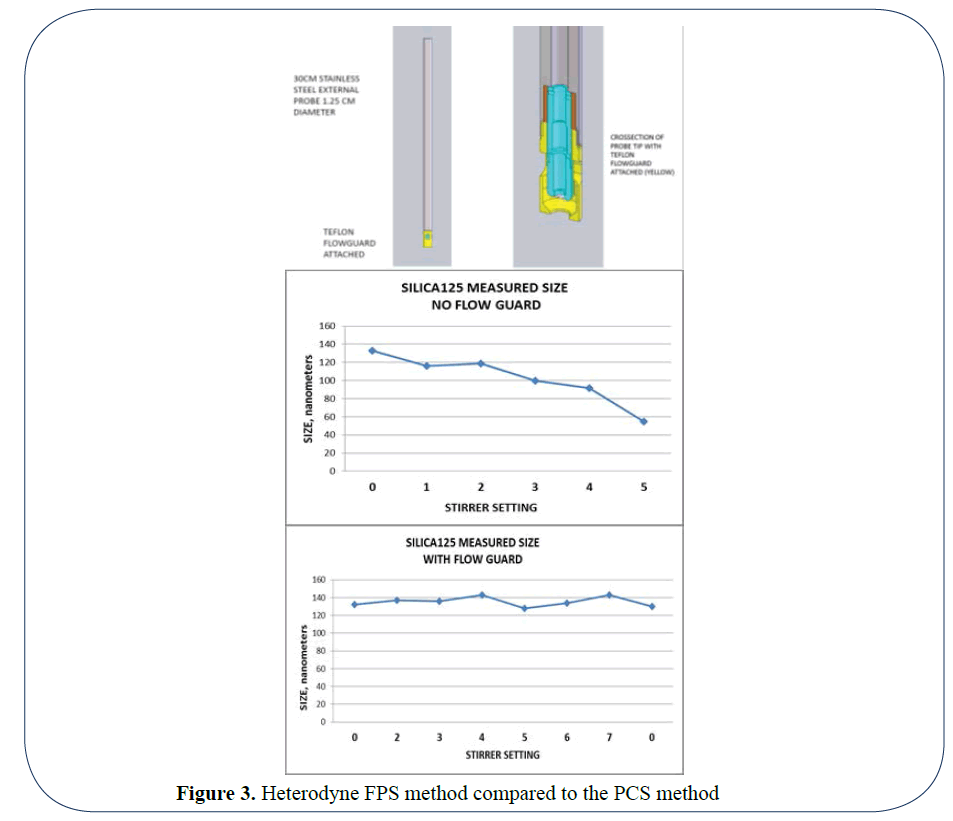
Figure 3: Heterodyne FPS method compared to the PCS method
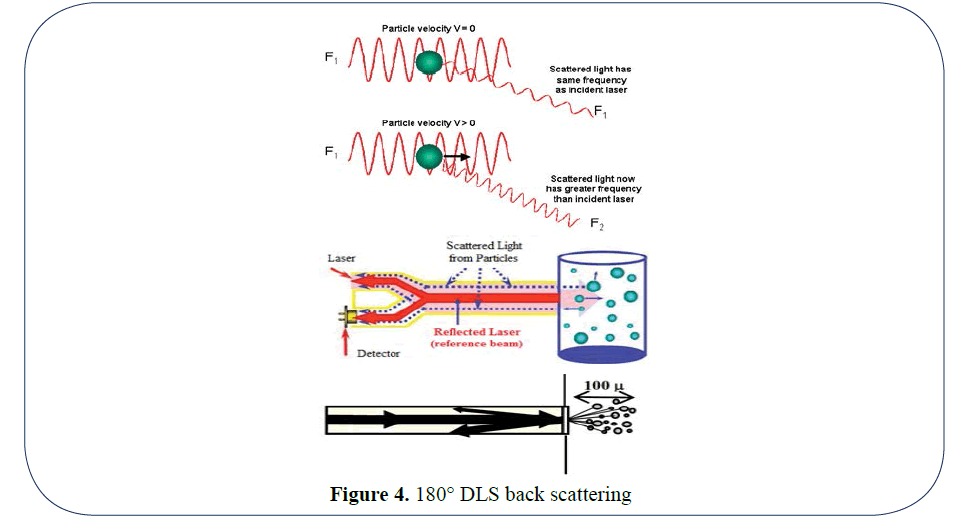
Figure 4: 180° DLS back scattering
Methods
What about the chemistry of dilution, why is it so potentially problematic? The answer lies purely in the instabilities created within the suspension when it is diluted and its zeta potential changes.
The most important parameter to affect the stability of a suspension is the pH. In Figure 5 we can see dramatic effect on the zeta potential when performing a pH titration.
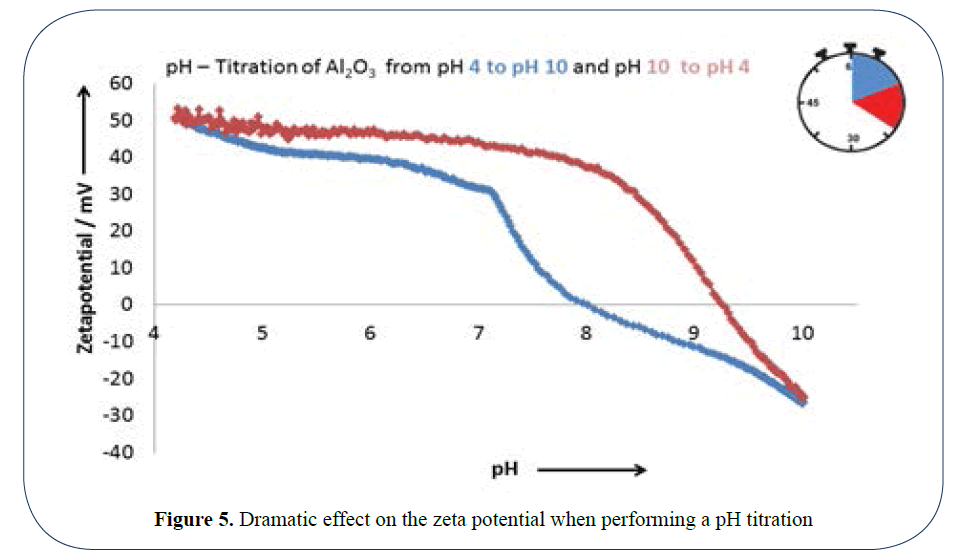
Figure 5: Dramatic effect on the zeta potential when performing a pH titration
The product is stable in low pH acidic dilutions, but as the pH increases the product reaches the isoelectric point and becomes very unstable and agglomerates, as is shown in Figure 6 where the size of the suspension increases from 150 nM to greater than 1000 nM. It is thus very important to know the original pH of your suspension and dilute accordingly with a solution of that pH.
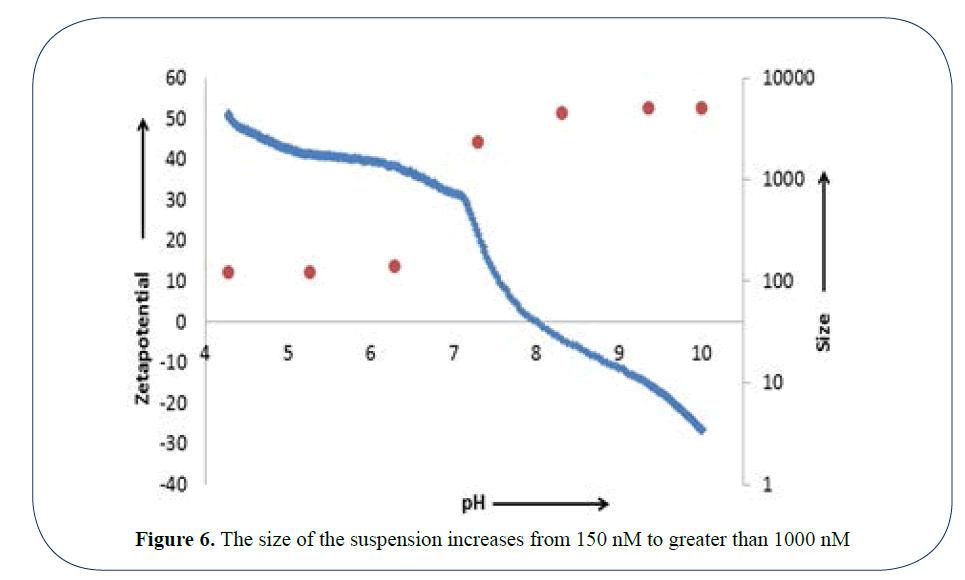
Figure 6: The size of the suspension increases from 150 nM to greater than 1000 nM
The second most important parameter to monitor and control is that of surfactant concentration. Yet again if any dilution is to take place the surfactant concentration in the dilution must remain the same. Surfactant can provide stability in a suspension and any dilution of the surfactant in the suspension can reduce the zeta potential and cause the particles to agglomerate.
The third parameter which must be considered is that of conductivity or salt concentration. In this case an addition of salt causes the zeta potential to plummet, so yet again, upon dilution, the suspension’s original salt concentration or conductivity must be maintained. This added difficulty is demonstrated in Figure 7.
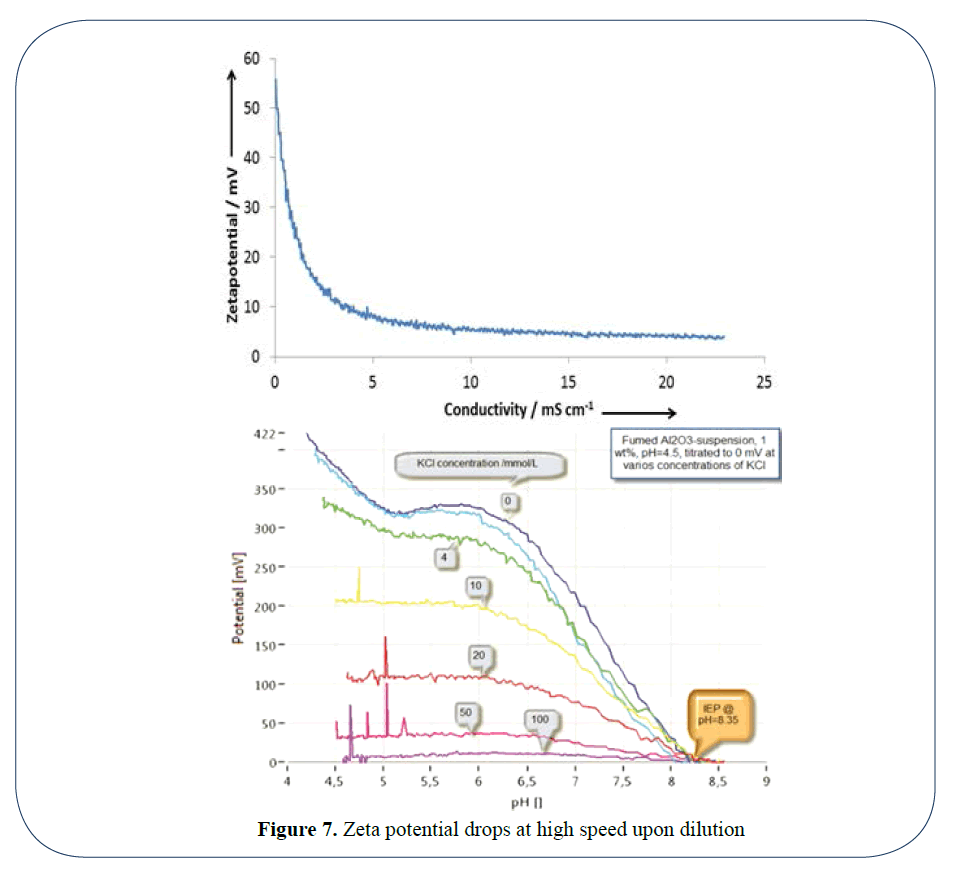
Figure 7: Zeta potential drops at high speed upon dilution
Results
The problems of not caring about the chemistry of dilution are shown in the comparison result (Figure 8) of a material which when measured undiluted revealed a bimodal distribution with a shoulder at the fine end of the range. When diluted 50/50, a large quantity of fines agglomerated to provide a monomodal distribution which would be misleading to most researchers.
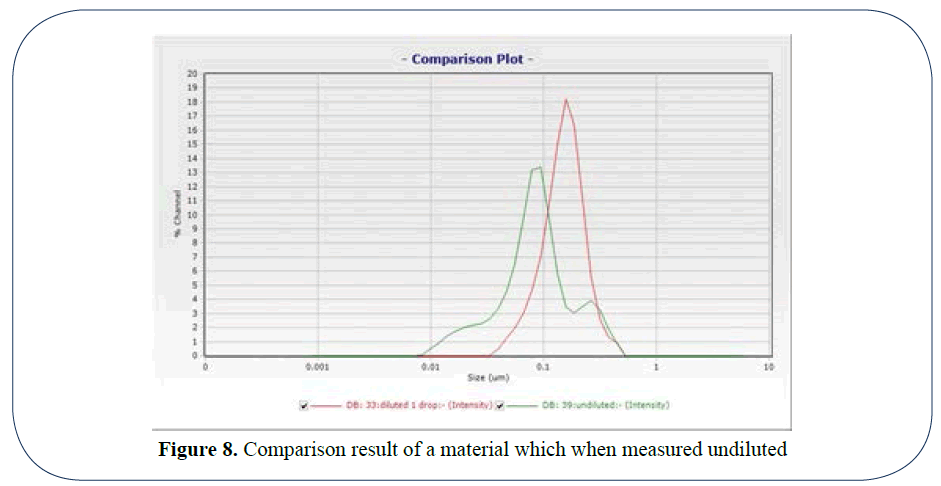
Figure 8: Comparison result of a material which when measured undiluted
In the following examples (Figure 9) we can see that the Nanoflex FPS technology which is not constrained by software models or predetermined by the user to expect a certain type of curve, yields accurate results unobtainable by standard PCS methods which model a seemingly perfect bell curve [2].
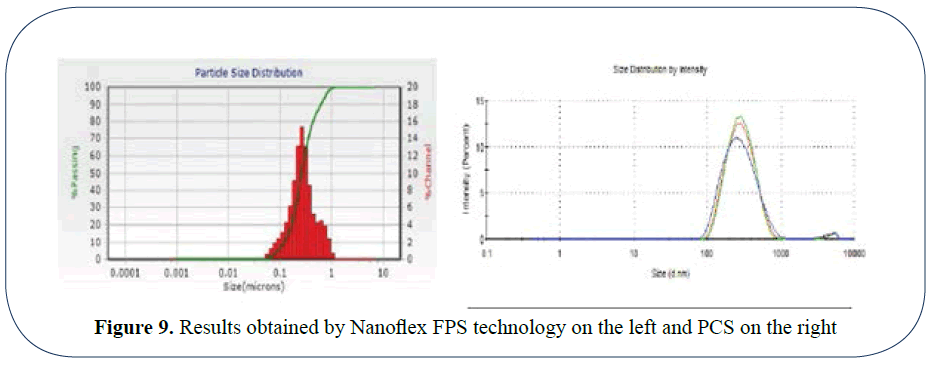
Figure 9: Results obtained by Nanoflex FPS technology on the left and PCS on the right
In Figure 10, 2 populations are missed due to curve fitting routines which FPS does not need or use. We reveal a population from 15 to 100 nm which is completely missed by the PCS result on the right. In fact the post 1 micron population is also missed by the PCS analysis.
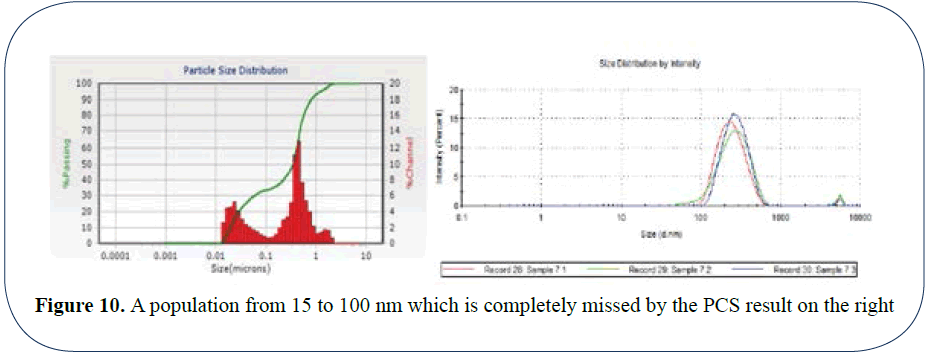
Figure 10: A population from 15 to 100 nm which is completely missed by the PCS result on the right
In the final example in Figure 11, the material has gone through a 0.2 micron filter which is demonstrated by the maximum size of 0.2 micron in the FPS Nanoflex result on the left but not the PCS result on the right. The lower limit of 20 nm is accurately determined by both the FPS and PCS systems but the PCS result on the right shows a seemingly perfect bell curve with a peak at 80 nm whereas the reality is depicted by the Nanoflex FPS result on the left where the true peak at 35 nm not 80 nm is located.
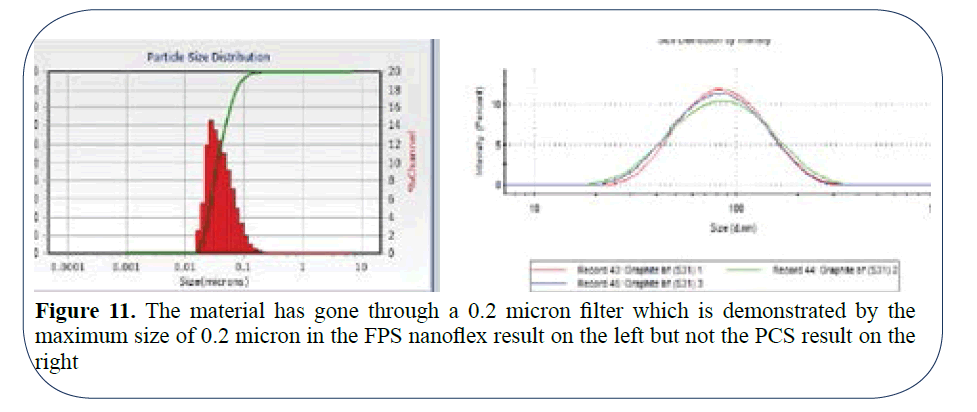
Figure 11: The material has gone through a 0.2 micron filter which is demonstrated by the maximum size of 0.2 micron in the FPS nanoflex result on the left but not the PCS result on the right
Discussion
So we have a technology which can measure suspensions without dilution, which is an obvious advantage to researchers, QC and QA managers who have not known of the pitfalls of dilution before. Frankly do they have the time to correct the situation by performing all the titration tests I have suggested in order to fully understand and dilute the suspension with a diluent that is as close as possible to the original formulation? With the Nanoflex-No dilution system, they can measure the suspension as it is without creating a new agglomerated suspension which bears no reality to the original size.
More importantly, what does a no dilution system provide you not in the future but now?
Well first of all it is now possible to measure your suspensions on-line with or without dilution as is shown in (Figure 12) [3].
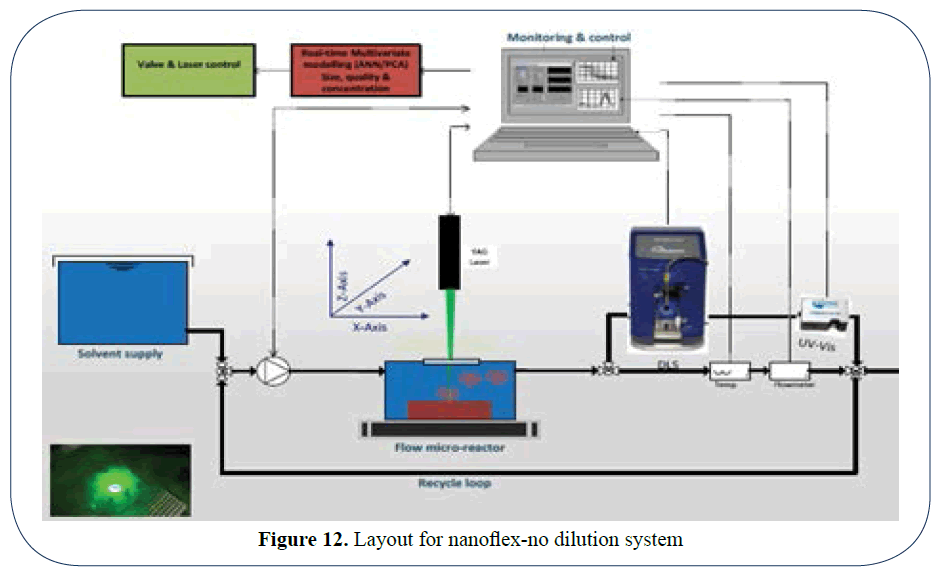
Figure 12: Layout for nanoflex-no dilution system
In addition we can take it further and measure directly in-line, in a reactor or indeed any kind of vessel where you want to measure accurately undiluted and in real time as is shown in the formulation vessels shown in the pictures 8-10 below and the (Figure 13) where a material was decreased in size and monitored for 120 minutes until the correct size was attained. We now have eyes in the process for nano-materials.
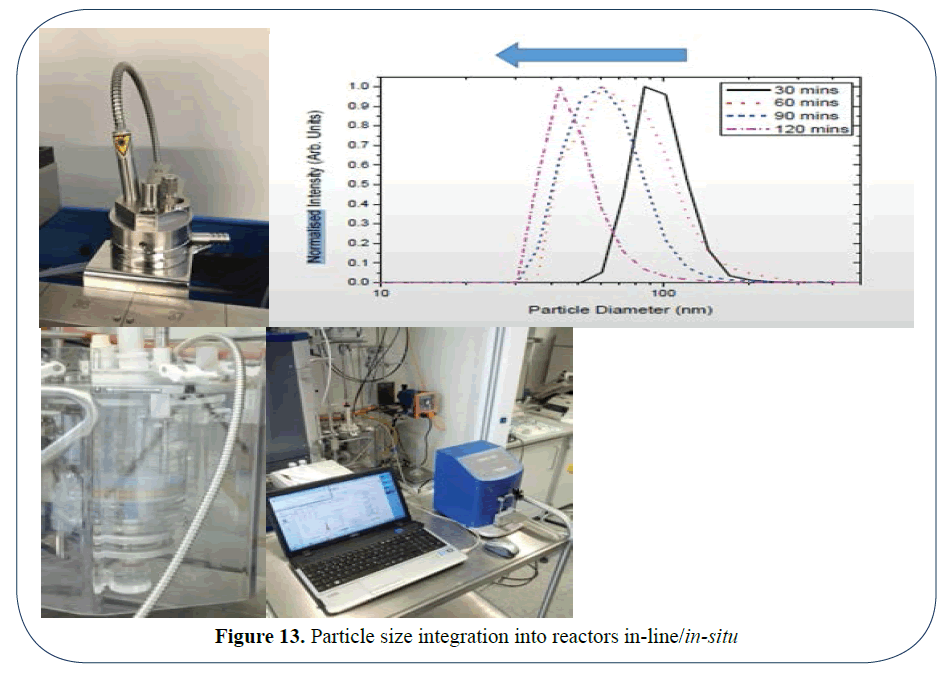
Figure 13: Particle size integration into reactors in-line/in-situ
Conclusion
The knowledge to effect good measurements on nanomaterials has been around for a long time but in many particle size measurements the thought that is needed when diluting suspensions has not been used and is often ignored as a minor inconvenience. The reality is that even a change of water supply has the potential to change the result. Microtrac by introducing the Nanoflex technology has enabled users to measure their samples undiluted and hence attain accurate results. Some materials size changes when there is a change of temperature or pressure, so the ability to measure either on-line in a bypass or in situ in the process vessel with no dilution is truly a “Holy Grail” for Research Scientists.
References
- Freud PJ. Nanoparticle sizing: Dynamic light scattering.Microtrac Application Notes. 2007;1-7.
- Freeland B, McCann R,Bagga1 K, et al.Nanoparticle fabrication via pulsed laser ablation in liquid: A step towards production scale-up.2014.
- Benen TD, Trainer M, Paul J. Freudnanoparticle sizing 2.0: Dynamic light scattering in the frequency spectrum mode. 2014.