Key words
GHG emission, Wheat production, Energy in agriculture, Energy ratio
Introduction
In order to maximize the efficiency of modern agricultural technology to farms in a target region, the farming
system of the region should be first characterized, especially to identify possible resource constraints and to capture
the diversity of farming systems [32]. Currently, agricultural operations have to adapt to a more competitive
environment and consequently, use new intelligent technologies [19]. Hydroponics and greenhouse production are
the way of obtaining profitable crops [22]. A sustainable crop production system requires keeping a high-quality
harvest, while keeping energy and raw material consumption low. The agricultural sector is an important energy
consumer. Farmers have an option for reducing energy use by investing in intelligent systems [12]. Wheat is one of
the top three most producing cereals in the world, ranks the second place after corn and followed by rice. Winter
wheat is one of the most major crops that have been planted in Iran. Planted area was 12.96 million ha in 2005-2006.
Cereal planted area was 9.37 (72.28%) million ha, which includes wheat (73.24%), barely (16.73%), paddy (6.73%)
and corn (3.12%).Total harvested cereals in 2005-2006 were 22.40 million tons of which wheat recorded of 65.47%
followed by barely (13.20%), paddy (11.66%) and corn (9.67%) respectively [3]. At least, 40% of Iran's wheat is dry
with an average yield of only 0.8 tons ha-1. Even in irrigated farms the average yield of wheat rarely exceeds three
tons ha-1, which is low in comparison to the world standards [2]. Global warming is one of the most important issues
in recent century. Global warming is the continuing rise in the average temperature of Earth’s atmosphere and
oceans and is caused by increased concentrations of greenhouse gases in the atmosphere, resulting from human activities such as deforestation and burning of fossil fuels. There is scientific agreement that global warming poses
one of the major environmental challenges in the future. While the bulk of the so called greenhouse gases (GHG)
originate from fossil fuel consumption. Burning fossil fuels results in the emission of carbon dioxide (CO2), nitrous
oxide (N2O) and methane (CH4) that act as barriers to thermal radiation and prevent it from leaving the Earth’s
atmosphere, the so-called greenhouse effect [10]. As a consequence, the global mean temperature has increased
during the past 100 years and raised concerns over global warming and uncertainty over future impacts on the
climate [23]. A reduction in greenhouse gas emissions by minimizing the quantity of fossil fuels burnt is therefore
essential to arrest global warming. Although the increased use of agricultural inputs in modern farming has resulted
in an increase in the energy inputs for fertilizer and crop protection chemicals, higher yields have increased the
energy output per unit area and per unit of input [23]. Cetin and vardar [5] studied on differentiation of direct and
indirect energy inputs in agro industrial production of tomatoes. Erdal et al [7] have studied on energy consumption
and economical analysis of sugar beet production. Damirjan et al [6] studied the energy and economic analysis of
sweet cherry production. Alam, et al [1] studied the energy flow in agriculture of Bangladesh for a period of 20
years. Satori et al [26] studied the comparison of energy consumption on two farming system of conservation and
organic in Italy. In recent years, Data Envelopment Analysis as a non-parametric method has become a central
technique in productivity and efficiency analysis applied in different aspects of economics and management
sciences. Although within this context, several researchers have focused on determining efficiency in agricultural
units and various products ranging from cultivation and horticulture to aquaculture and animal husbandry for
example: surveying the quantity of inefficient resources which are used in cotton production in Panjab in Pakistan
[27], reviewing energy performance used in paddy production [21] surveying improving energy efficiency for garlic
production [25] evaluation and development of optimum consumption of energy resources in greenhouse cultivation
in Tehran province [9] A further comparative review of frontier studies on agricultural products can be found in [20,28,29,30].
The main objectives of this research were to investigate the energy use patterns, examine the greenhouse gas
emission and analyze the energy input–output in cultivation of wheat in Gorve city, Kordestan province of Iran.
Materials and Methods
The research was done in Gorve city, Kordestan province of Iran which is located in the west of Iran. The data used
in this study, has been collected form 40 wheat farms in Gorve city. A simple random sampling method was used to
determine survey volume and the farms were chosen randomly from study region. The data included amount of
inputs used in wheat production such as human labor, machinery, diesel fuel, fertilizers, biocide, electricity (for
irrigation) and seeds, and the yield as an output. The inputs and output were transformed to energy term by multiply
their Quantity per unit area by the coefficient of energy equivalent. For this propose the energy coefficient of
previous study was used (Table 1). The inputs energy equivalents used in wheat production with output energy rates
are shown in the Table 2.
Table 1: Energy equivalent of inputs and output in agricultural production
Table 2: Greenhouse gas (GHG) emission coefficients of agricultural inputs
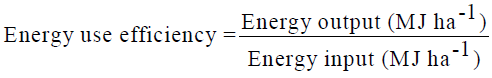
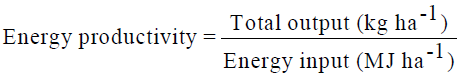
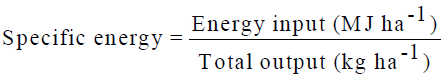
Based on the energy equivalents of the inputs and output (Table 1), the energy ratio (energy use efficiency), energy
productivity, specific energy and net energy gain were calculated [18]:
 (1)
(1)
 (2)
(2)
 (3)
(3)
Net energy = Energy Output (MJ ha-1) - Energy Input (MJ ha-1) (4)
The energy use efficiency is one of the indices that show the energy efficiency of agriculture. In particular, this ratio,
which is calculated by the ratio of input fossil fuel energy and output food energy, has been used to express the
ineffectiveness of crop production in developed countries [31]. An increase in the ratio indicates improvement in
energy efficiency, and vice versa. Changes in efficiency can be both short and long term, and will often reflect
changes in technology, government policies, weather patterns, or farm management practices. By carefully
evaluating the ratios, it is possible to determine trends in the energy efficiency of agricultural production, and to
explain these trends by attributing each change to various occurrences within the industry [31].
The amounts of GHG emission from inputs per hectare were calculated by using CO2 emission coefficient of
agricultural inputs (Table 2). The amount of produced CO2 was calculated by multiplying the input application rate
(diesel fuel, chemical fertilizer, chemicals and Machinery) by its corresponding emission coefficient that is given in
Table 2.
Results and Discussion
As it can be seen in the Table 2, 77.97 kg nitrogen, 34.98 kg Phosphate, 9.99 kg Calcium, 4587.50 kg of farm
fertilizer, 72.95 l diesel fuel, 2.25 kg Biocides, 260.75 kg seed, 98.47 h human labor, 21.64 h machinery, 2190.77
Kwh electrical energy per hectare are used for the production of wheat in Gorve city in Iran. The average wheat
output were found to be 7325 kg ha-1 in the enterprises that were analyzed. The energy equivalent of this is
calculated as 97935.63MJha-1. The highest energy input is provided by electrical. Some results have been reported in
the literature that the energy input of chemical fertilizers has the biggest share of the total energy input in
agricultural production [17,21,28, and 20]. The share of each input can be seen in Figure 1.
Figure 2: HPLC chromatogram of the nine reference compounds in 50% aqueous methanol, measured at 370nm. Retention times for rutin, sutherlandin A, sutherlandin B, kaempferol-3-O-rutinoside, sutherlandin C, sutherlandin D, quercitrin, quercetin and kaempferol were 11.9, 12.7, 13.8, 15.3, 16.2, 17.0, 18.0, 26.2 and 28.1 minutes, respectively.
It can be seen in table 3 that the ratio of direct and indirect energy and also the ratios of renewable and non–
renewable energy are fairly different from each other in wheat production. Erdal et al [7] investigated the
relationship between fruit yield and energy inputs used in stake tomato production under field conditions in Tokat
province of Turkey. They reported that among the total energy used, 57.12% was in the form of direct energy and
77.54% was in the form of non-renewable energy.
Table 3: Amounts of inputs, outputs and energy inputs and output in wheat production
The energy use efficiency, energy productivity, specific energy and net energy gain of wheat production in Gorve
city are listed in Table 4. The energy use efficiency in this production was found to be 2.27. The energy ratio is often
used as an index to examine the energy efficiency in crop production [14].
Table 4: Energy inputÃÆÃâÃââÃÆââ¬Å¡Ã¢ââ¬Å¡Ã¬ÃÆââ¬Å¡Ã¢ââ¬Ã
âoutput ratio and forms in wheat production
The energy ratio for some crops are reported as 2.8 for wheat, 4.8 for cotton, 3.8 for maize and 1.5 for sesame [4]
and 1.25 for potato [19]. The energy productivity and specific energy of wheat production was calculated as 0.17 kg
MJ–1and 5.87 MJ kg–1 respectively. The net energy of wheat production was found to be 54937.19MJ ha–1. It
indicates that in this crop production energy is gained (net energy is greater than zero). In literature, similar results
have been reported [8,16].
The results of greenhouse gas emission wheat production are shown in Table 5. The highest value of GHG emission
belonged to diesel fuel with (201.34 kg CO2eq ha-1) of total emission and followed by Chemical fertilizer with
(101.3 and 6.99 CO2eq ha-1for Nitrogen and Phosphate). Using chemical fertilizer (especially nitrogen) more than
need led to high amount of GHG emission. Moreover, soil and water pollutions are the results of using high amounts
of chemical fertilizer which makes agriculture environment unfriendly. The least amount of GHG emissions
producer input in wheat production was Pesticides with amount of 11.47 CO2eqha-1 of total GHG emissions (Table
5).
Table 5: Energy inputÃÆÃâÃââÃÆââ¬Å¡Ã¢ââ¬Å¡Ã¬ÃÆââ¬Å¡Ã¢ââ¬Ã
âoutput ratio for wheat production in Gorve city
Table 6: GHG emission of inputs in wheat production
Some of the investigations that have been done in greenhouse gas(GHG) emissions on wheat and other crops as
follows: Khakbazan et al [11] calculated the greenhouse gas emissions from wheat production and found that it can
be ranged from 410 kg CO2eq ha-1 to 1130 kg CO2eq ha-1 depending on fertilizer rate, location and seeding system.
Kramer et al [13] calculated the total greenhouse gas emissions related to the Dutch crop production system (potato,
grain, vegetable and.) and found that the agricultural products produce 1100 k ton CO2, 3 k ton N2O and 0.7 k ton
CH4. The results indicated the production of 0.147 kg CO2eq per kg of potato production.
Conclusion
The main objectives of this research were to investigate the energy use patterns, examine the greenhouse gas
emission and analyze the energy input–output in cultivation and vegetables in Gorve city, Kordestan province of
Iran. Based on the present study the following conclusions are drawn:
1. The total energy consumption for wheat production was 42998.44 MJha-1. Highest energy consumption related to
electricity and chemical fertilizers. The lowest share of energy consumption belonged to human labour and biocide.
2. The energy use efficiency, energy productivity, specific energy and net energy for wheat production were 2.27,
0.17 kg MJ–1, 5.87 MJ kg–1 and 54937.19 MJ ha–1, respectively.
3. In this research, the highest value of GHG emission belonged to diesel fuel with (201.34 kg CO2eq ha-1) of total
emission and followed by Chemical fertilizer with (101.3 and 6.99 CO2eq ha-1for Nitrogen and Phosphate). The least
amount of GHG emissions producer input in wheat production was Pesticides with amount of 11.47 CO2eqha-1 of
total GHG emissions.
References
- Alam MS, Alam MR, Islam KK. American Journal of Environmental Science. 2005. 1: 213-220.
- Anonymous (2007). www.fao.org
- Anonymous (2009). Ministry of Agriculture- Jihad of Esfahan Province of Iran.
- Canakci, M., Topakci. M., Akinci. I. and Ozmerzi. A. Energy Convers. Manage, 2005. 46: 655–666.
- Cetin B, Vardar A. Renewable Energy. 2008. 33: 428-433.
- Demirjan V, Ekinci KK, Akbolat DHM, Ekinci C. Energy Conversion and Management. 2006. 47: 1761-1769.
- Erdal G, Esengun K, Guduz O. Energy. 2007. 32: 34–41.
- Esengun, K., Gunduz. O. and Erdal. G. Energy Convers. Manage, 2007. 48: 592–598.
- Gochebeyg F, Omid M, Ahmadi H, Delshad D. 2009. Agriculture and natural resources faculty, University of Tehran.
- Intergovernmental Panel on Climate Change (IPCC). 1997. IPCC Technical Support Unit, London.
- Khakbazan M., R.M. Mohr, D.A., Derksen, M.A., Monreal,C.A., Grant, R.P., Zentner, A.P., Moulin, D.l., McLaren, R.B., Irvine and C.N. Nagy. Soil and Tillage Research, 2009.104: 30-38.
- Korner, G. and Straten, V. Computers Electronics Agric. 2008. 60: 18–30.
- Kramer K.J., H.C. Moll and S. Nonhebel. Agriculture Ecosystems and Environment, 1999. 72: 9-16.
- Kuesters. J. and Lammel. J. Eur. J. Agron, 1999.11; 35–43.
- Mahmoud, O. Int. J.Agric Biol. 2004. 6:1084–1088.
- Mandal, K.G., Saha. K.P., Gosh. P.L., Hati. K.M. and Bandyopadhyay. K.K. Biomass. Bioenergy, 2002. 23: 337–345.
- Mobtaker HG, Akram A, Keyhani A. 2011. Energy for sustainable development (In press).
- Mohammadi, A., Omid. M. Appl Energy, 2010. 87: 191–196.
- Mohammadi, A., Tabatabaeefar. A., Shahin. S., Rafiee. S. and Keyhani. A. Energy Conver. Manage, 2008. 49: 3566–3570.
- Monjezi N, Sheikhdavoodi MJ, Taki M. Modern Applied Science. 2011. 5(6): 139-151.
- Nassiri SM, Singh S. Applied Energy. 2009. 86: 1320–5. Nelson, P.V. Greenhouse operation and management. 6th edition.pp: 2002.128–147.
- Pimentel, D., L.E. Hurd, A.C., Belloti, A.C., Forster, M.J., Oka, I.N., Scholes, O.D., A.G. Salway. 1996. ISBN 0-7058-1728-8.
- Pimentel, D., L.E., Hurd, A.C., Bellotti, M.J., Forster, I.N., Oka, O.D. Sholes and R.J.Whitman.1973. Science, 182: 443–449.
- Samavatian N, Rafii Sh, Mobli M. 2009. Agriculture and natural resources faculty, University of Tehran.
- Satori L, Basso M, Bertocco B, Oliviero G. Bio system Engineering. 2005. 91(2): 245-246.
- Shafiq M, Rehman M. Agric. Econ. 2000. 22: 321-330.
- Taki M, Ajabshirchi Y, Mahmoudi A. Modern Applied Science. 2012a. 6(1): 75-87.
- Taki, M., Abdi, R., Akbarpour, M., Mobtaker, HG., CIGR Journal, 2013.15, 59–67.
- Taki, M., Mahmoudi, A., Mobtaker, HG., Rahbari, H., CIGR Journal, 2012b. 14, 93–101.
- Unakitan, G., Hurma. H. and Yilmaz. F. Energy, 2010. 35: 3623–3627.
- Zangeneh, M., Omid, M. and Akram, A. African journal of Agricultural Research, 2010. 5(10): 993-998.
- Zhang, X., Huang G.H., Lin, Q., Yu, H., Expert Systems with Applications 2009. 36, 5666–5672.


