Keywords
Instant slowdown; Mean slowdown; Mean Re-sponse time; Revenue
Introduction
Cloud computing represents the delivery of computing as a service. In this case, resources such as CPU, software, information, and devices are provided to end-users as ame-tered service over the Internet. There are probably as many definitions of cloud computing as there are opinions about its future. To date, there is no definition that is agreed upon in most quarters. According to National Institute of Standards and Technology (NIST) [1], cloud computing can be defined as “the management of resources, applications and information as services over the cloud (Internet) on demand.” Cloud computing is a model for enabling convenient and on demand network access to a shared group of computing resources that can be rapidly released with minimal management effort or service provider interaction.
The cloud makes it possible for one to access information from anywhere at any time [2-4]. While a traditional computer setup requires one to be in the same location as the data storage device, the cloud removes the need for one to be in the same physical location as the hardware that stores the data.
The business model based on Service Level Agreements (SLAs) play a crucial role in Cloud paradigm. SLA provides mechanisms and tools that allow service providers and end users to express their requirements and constraints such as mean response time, mean slowdown and price scheme. The mean response time is the total amount of time a request spends in both the queue and in service [5]. Mean slowdown is the ratio of mean response time to the size of the requests. Pricing scheme is the process of determining what a service provider will receive from an end user in exchange for their services. SLAs facilitate the transactions between customers and service providers by providing a platform for consumers to indicate their required service level or Quality of Service (QoS) [6]. SLA normally specifies a common understanding about responsibilities, guarantees, warranties, performance levels in terms of availability, response time, etc [7].
The challenge is how much physical resources must be assigned to maintain the promised level of performance as described in SLAs.
SLAs are not punitive contracts that are waved around in anger every time there is a problem. Instead they are key to improving the ability of service providers to meet the exact needs of its customers [8]. Service providers usually charge customers according to the achieved performance level [9]. SLA becomes the fundamental basis for service providers to provision their cloud resources. The service provider using a multi-tenant model assigns the pooled computing resources in the form of a virtual machine to multiple consumers. The pooled physical resources can be assigned and reassigned to the different virtual machines dynamically based on con-sumer’s requests and available resources.
Since resource allocation strategies have an impact on the service performance, a fundamental problem faced by any Cloud service provider is how to maximize revenue by allo-cating resources dynamically among the service instances and providing differentiated performance levels based on SLA and measurable performance indices. Generally, more resources are allocated for those instances with high arrival rate and high price in order to obtain high revenues. However, other instances where more resources are allocated for instances with high throughput (high arrival rate) and a low price is charged do also exist [7].
The main objective of the study is to maximize revenue using resource allocation in cloud computing environments based on Mean Slowdown and Instant Slowdown customeroriented pricing mechanisms. The rest of the paper is organized as follow; in the next section, we present the related work, in section III we present the system model. In section IV, we present the performance evaluation and finally conclude in section V.
Related work
Previous researches on cloud computing were carried out to determine job scheduling system algorithm using queueing models [10,11]. However, the majority of these works do not take the economic issues related to SLAs into account. As cloud computing becomes more and more popular, under-standing the economics of cloud computing becomes critically important. To maximize the profit, a service provider should understand both service charges and business costs, and how they are determined by the characteristics of the applications and the configuration.
Yeoa et al., [12] described the difference between fixed and variable prices. Fixed prices were easier to understand and more straightforward for users. However, fixed pricing could not be fair to all users because not all users had the same needs. Their study proposed charging variable prices with advanced reservation. Charging variable pricing with advanced reservation would let users know the exact expenses that are computed at the time of reservation even though they were based on variable prices.
Mihailescu and Teo [13], the authors presented a dynamic pricing scheme which improves the efficiency of batch resource trading in fed-erated cloud environments. In their scheme, the whole cloud system is considered as a uniformed resource market where resource supply and demand can be balanced by using macro-economic equivalence theory. Unfortunately, the scheme relies on market self to automatically obtain equivalent price, making it low-efficient compared with the opening feature of cloud platform.
Zhu et al. [14] proposes an allocation strategy of server re-sources among customers to minimize the mean response time. However, this work does not consider the economic model. In a similar study [15] two strategies for resource allocation was proposed, Heuristic and Greedy. Although Greedy strategy is optimal, it often costs long execution time. Heuristic is simple but its validity is affected by the environment parameters.
In an effort to maximize revenue, Feng et al. [7] mod-eled revenue maximization in cloud computing using an M/M/1/F IF O queue system for a single virtual machine. First In First Out (FIFO) is normally used as a base line for temporal fairness, where it is fair to serve a job in the order in which it arrives, such scenarios are found in e-commerce (that is, an item gets sold to the person who first requests for it), databases and other applications where data consistency is important [16]. The authors proposed two customer-oriented pricing mechanisms; Mean Response Time (MRT) and Instant Response Time (IRT), in which the customers are charged according to achieved service performance in terms of mean response time.
However, mean response time tends to be representative of the performance of just a few big requests since they count the most in the mean because their response times tend to be highest [17]. In other words an improvement in mean response time could imply the performance of a few big requests has improved. To overcome the above challenges, we propose two customeroriented pricing mechanisms Mean Slowdown (MS) and Instant Slowdown (IS), in which the customers are charged according to achieved service performance in terms of mean slowdown. Mean slowdown is the ratio of mean response time to the size of the request. Instant slowdown is the slowdown averaged over a given period of time and is normally used when the expected revenue does not vary much over a given period of time. The advantages of mean slowdown over mean response time is that it is more representative of the performance of a larger fraction of requests. Secondly, mean slowdown ensures that a request’s mean response time is correlated to its size. Two scheduling policies are considered, that is, FIFO and Processor Sharing (PS). Processor sharing (PS) is used as a base line for proportional fairness where it is fair for the response time of jobs to be proportional to the job size; such scenarios are found in web servers, and routers to ensure no class of jobs is starved [18].
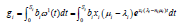
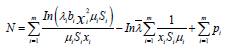
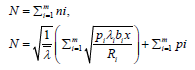
The expression for mean revenue in terms of Mean Re-sponse Time (MRT) is given in [7] as:
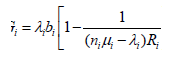 (1)
(1)
On the other hand, the expression for overall mean revenue in terms of Instant Response Time (IRT) is given in [7] as:
 (2)
(2)
The main objective of the study is to maximize revenue us-ing resource allocation in cloud computing environments based on Mean Slowdown and Instant Slowdown customeroriented pricing mechanisms. The rest of the paper is organized as follow; in the next section, we present the system model. In section III, we present the performance evaluation and finally conclude in section IV.
System model
In this paper, we employ queueing theory to model MS and IS pricing schemes. Among existing analytical tools, queuing theory has been proved to be a useful tool to deal with queuing problems in communication networks [7,19], Queuing theory is a primary tool for studying Mean Response Time (MRT) and Instant Response Time (IRT) [7], and other performance metrics [21,14]. We consider resource allocation model in terms of Mean Slowdown and Instant Slowdown.
Resource allocation Model in terms of Mean Slowdown
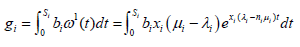
Mean slowdown is a commonly used metric to evaluate the service performance [7,16]. Mean slowdown of requests can be modeled using M/M/ ni/FCFS and M/M/ni/PS queuing systems. For a time-slotted system, it is important to calculate the mean slowdown of every time slot independently because arrival rate of requests vary over time. The billing under this model is such that each mean slowdown has its own rate. Every service instance has a different rate, which is determined by the customer’s actual requirement. This pricing model is also called service demand driven model [14].
The billing under this model is such that each mean slowdown has its own rate. Every service instance has a different rate, which is determined by the customer’s actual requirement.
Let F denote an offset factor of actual mean slowdown to benchmark.
We define F as
 (3)
(3)
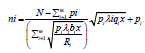
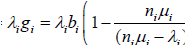
Where (r/x) is the measured mean slowdown during a time slot, s represents a benchmark of mean slowdown defined in the SLA while r is the mean response time and x is the job size. Every service instance has different s, which is determined by customer’s actual requirement. For example, in terms of response time, the recommended response time for transactions in e-commerce is 2-4 seconds [7]. We formulate the pricing mechanism as
 And
And (4)
(4)
Where B is the price of each service provision and b is the price constant. [H] Pseudocode for allocation model based on mean slowdown Requests arrive in the system Classify requests according to SLA Mean slowdown is less or equal to threshold in SLA Allocate Resources and charge the customer an amount B Mean slowdown is greater than threshold in SLA Do not allocate resources and do not charge the customer
Algorithm 3 shows how customers are allocated resources and charged in a cloud computing environment based on mean slowdown.
Resource allocation model in terms of Instant Slowdown (IS)
The pricing model in terms of Mean Slowdown may work well when the measurements are evenly distributed over a narrow range. However, mean slowdown is not meaningful as a performance metric when the mean slowdown varies a little over a large range. This motivates us to propose another pricing model in terms of Instant Slowdown. A request under IS is charged according to the measured slowdown. The billing under this model is determined by the number of service provisions with mean slowdown less or equal to a given threshold. The same rate is charged for a particular interval. [H] Pseudocode for allocation model based on Instant Slowdown Requests arrive in the system Classify requests according to SLA Number of service provisions with mean slowdown less or equal to a given threshold Allocate Resources and charge the customers an amount B Number of service provisions with mean slowdown greater than a given threshold Do not allocate resources and do not charge the customers Algorithm 4 shows how customers are allocated resources and charged in a cloud computing environment based on Instant slowdown. Given certain customer arrival patterns and service requirements, the order of service is the most important point affecting the performance of a service management facility [16].
Specifically, we use the M/M/ni/FIFO and M/M/ni/ PS queuing systems, where the first M represents Poisson arrival with mean arrival rate per request with exponentially distributed inter arrival times. Poisson distribution best models random arrivals into systems [5]. Poisson probability distribution is given as:
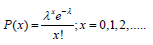 (5)
(5)
Where x=number of arrivals in a specific period of time, = average, or expected number of arrivals for the specific period of time, e = 2.71828. The second M represents exponential service time and the 1 represents the number of servers. Each service instance, a virtual machine associated with a user, is modeled as M/M/ni/PS queue and later extended to multiple servers to give a service rate of n μ i. The exponential probability distribution is given in [5] as:
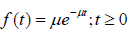 (6)
(6)
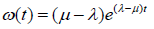
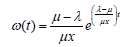
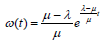
→ Where t=service time (expressed in number of time periods), μ = average, or expected number of units that the service facility can handle in a specific period of time, Processor Sharing (PS) is the scheduling policy used to give service in this study. We define service intensity, → as the ratio of arrival rate to the service rate, → =⊥/μ.
FIFO is used in this study because FIFO serves jobs in the order in which it arrives, such scenarios are found in e-commerce (that is, an item gets sold to the person who first requests for it), databases and other applications where data consistency is important [16]. On the other hand Processor sharing (PS) is used as a base line for proportional fairness where it is fair for the response time of jobs to be proportional to the job size; such scenarios are found in web servers, and routers to ensure no class of jobs is starved [18].
The overall revenues generated during a time slot from each service instance are derived. The optimization problem is then formulated from the revenue generated. The optimization problem is then resolved using Lagrange Multiplier Method. The number of servers to ensure maximum revenue for each service instance is then determined.
We assume that the Cloud data centre is composed of N homogenous servers. The servers are grouped into clusters dynamically and each server can only join one cluster at a time. Each cluster is built from a number of homogeneous machines. Every service instance is mapped to a server cluster. Each cluster is virtualized as a single machine. A service provider signs long term SLAs with m customers. The dispatcher assigns the incoming requests to individual servers in the cluster. i.e, every service instance is allocated to n1, n2, ..., 2m servers to provide services. The dispatcher can also determine the scheduling policy at each server. Also assume that the requests from any service instance arrives to the system with Poisson distribution with average arrival rate
λ and the service times by one server follows a negative ex-potential distribution with average service rate μ1 (the number of requests processed per unit time). The service rate of the virtual machine with ni servers is then given by nμ1 . Each service instance, a virtual machine associated with a user, can be modeled as an M/M/ni/FCFS or M/M/ni/PS queue system. The billing under this model is determined by the number of service provisions with mean slowdown within a benchmark, S. Next, we derive the expression for revenue in terms of Mean Slowdown for FCFS and PS policies.
Derivation of expression for revenue in terms of mean slowdown for FCFS policy
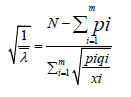
The average response time for an M/M/ni FCFS queue system is given in [5] as:
 (7)
(7)
Basing on equation 7, the mean slowdown Si of service instance i at the steady state is then given by
 (8)
(8)
Where xi=request size at instance i,
ni= number of servers at service instance i,
μi= service rate at service instance i,
λi= arrival rate at service instance i.
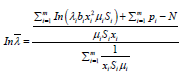
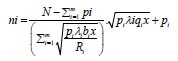
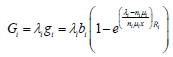
8. The service performance level Fi is then given by
 (9)
(9)
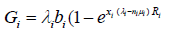
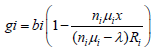
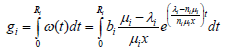
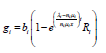
9. According to equation 4, the mean revenue gi brought by a service provision is,
 (10)
(10)
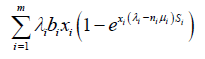
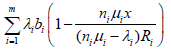
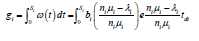
The overall revenue during a time slot from service instance is,
 (11)
(11)
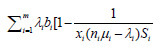
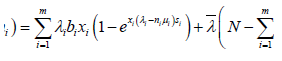
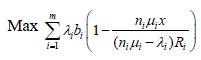
The optimization problem can then be formulated as: Maximize
 (12)
(12)
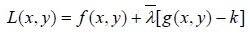
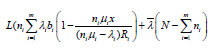
We resolve the problem in equation 12 using agrange Multiplier by constructing Lagrange composite function. To maximize or minimize the function f(x, y) which is subject to the constraint g(x, y) =k, we first create the Lagrange function. This function is composed of the function to be optimized combined with the constraint function in the following way
 (13)
(13)
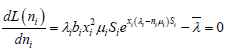
The partial derivative with respect to each variable x, y and the Lagrange multiplier of the function is found. Each of the partial derivatives is equated to zero.
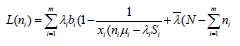
Therefore, given the optimization problem subject to the constraint given in equation 12, we use a similar argument as in equation 13 to obtain the following Lagrange function.
 (14)
(14)
 (15)
(15)
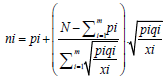
Where λ is a constant of Lagrange multiplier. To determine the maximum number of servers used for each service instance, we differentiate equation 14 with respect to ni and equate to zero.
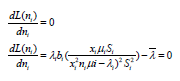 (16)
(16)
 (17)
(17)
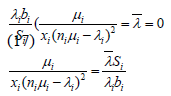
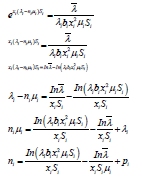
Simplifying equation 16, we obtain
 (18)
(18)
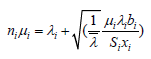
Hence we obtain
 (19)
(19)
Substuting equation 18 in to the constraint of optimization problem in equation 12
 (20)
(20)
 (21)
(21)
Substituting  from equation 20 in to equation 18, we obtain
 (22)
(22)
Equation 21 is valid only when the request arrival rate of each service instance is less than service processing rate. Otherwise, the queue length will be infinitely long. That is
 (23)
(23)
(Or)
 (24)
(24)
Therefore, the service allocation strategy guarantees that the mean slowdown is Si that is
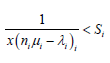 (25)
(25)
Which on simplification gives,
 (26)
(26)
Equations 23 and 25 offer the lower bound of assigned resources for each service instance. D. Derivation of expression for revenue in terms of Instant Slowdown for FCFS policy the response time probability distribution is,
 (27)
(27)
From equation 26, it follows that the sojourn time distribution is given by
 (28)
(28)
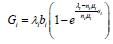
Where x is the job size. If service instance i is allocated to ni servers, then the mean revenue brought by a service provision is given by
 (29)
(29)
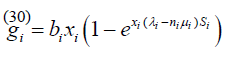 (30)
(30)
The overall mean revenue from service instance i during a time slot is
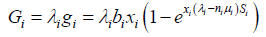 (31)
(31)
The optimization problem can be formulated as, maximize:
 (32)
(32)
Subject to
 (33)
(33)
By constructing the Lagrange composite function,
 (34)
(34)
 (35)
(35)
 (36)
(36)
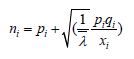
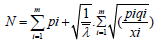
Substituting ni in equation 32,
 (37)
(37)
 (38)
(38)
Equation 38 also holds when arrival rate is less than the service rate of the virtual machine composed of all the assigned servers. E. Derivation of expression for revenue in terms of Mean Response Time for PS policy The average response time for an M/M/ni/PS queue system is given in [5] as:
 (39)
(39)
Therefore, the average response time ri of service instance at the steady state is given as
 (40)
(40)
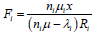
The service performance level Fi is given as
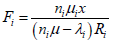 (41)
(41)
According to the pricing mechanism B=b (1-F), the mean revenue gi brought by a service provision is
 (42)
(42)
The overall revenue generated during a time slot from the service instance i is given by
 (43)
(43)
Formulating the optimization problem;
 (44)
(44)
Subject to
 (45)
(45)
multiplier method by constructing Lagrange composite function;
 (46)
(46)
 (47)
(47)
 (48)
(48)
 (49)
(49)
After further simplification, we obtain
 (50)
(50)
Substituting equation 50 into the constraint of the optimization problem,
We obtain
 (51)
(51)
 (52)
(52)
 (53)
(53)
The number of servers ni required to optimize revenue is given by equation (53.)
F. Derivation of expression for revenue in terms of Mean Slowdown for PS policy
The expression for Mean Slowdown for PS policy can be deduced by dividing mean response time under PS policy by job size x to get:
 (54)
(54)
The average mean slowdown si of service
instance i at the steady state is given as
 (55)
(55)
The service performance level Fi is given as
 (56)
(56)
Where Si is a benchmark mean slowdown for service instance i. According to the pricing mechanism, B = b (1 − F), the mean revenue gi brought by a service provision is
 (57)
(57)
This gives the overall revenue generated during a time slot from the service instance i as
 (58)
(58)
G. Derivation of expression for revenue in terms of Instant Response Time for PS policy The average response time probability distribution of an M/M/ ni/PS system is given in [5]
 (59)
(59)
The mean revenue brought by a service provision with ni servers is then given by
 (60)
(60)
 (61)
(61)
The overall mean revenue from service instance i during a time slot is
 (62)
(62)
H. Derivation of expression for revenue in terms of Instant Slowdown (IS) for PS policy.
The expression for Instant Slowdown for PS policy can be deduced by dividing mean response time for PS policy by job size x to get:
 (63)
(63)
The corresponding mean slowdown probability distribution of an M/M/ni/PS system is then given by
 (64)
(64)
The mean revenue brought by a service provision with ni servers is then given by
 (65)
(65)
 (66)
(66)
 (67)
(67)
Performance evaluation
In this section, we test the performance of the derived models. In particular, we analyze the variation of revenue with number of servers, and arrival rate of packets in the system. In each case, we compare the performance using response time and slowdown as performance metrics. The tool used for analysis is MATLAB. Basic mathematical symbols and evaluation parameters used in the analysis are indicated in table I and II respectively.
Comparison of MRT and MS, and IRT and IS under FCFS and PS policies: In this section, we investigate the variation of revenue with number of servers, and arrival rate of packets in the system.
Figure 1 shows a graph of revenue as a function of number of servers for Mean Response Time (MRT) and Mean Slowdown (MS) pricing mechanisms under FCFS policy. In doing this, we used equations 1, and 11 to plot the graph of revenue as a function of number of servers. To investigate the effect of increasing the number of servers, we fix the arrival rate, service rate and size of request. We observe that revenue generally increases with increase in number of servers regardless of the pricing mechanism. This is because as the number of servers increase, the number of tasks completed also increases and hence more revenue is generated. We further observe that more revenue is generated when MS pricing mechanism is used than when MRT pricing mechanism is used. The difference in revenue generated using MRT and MS is more pronounced for low number of servers as compared to high number of servers. For example, when the number of servers is 20, the Revenue generated using MRT is approximately $5.5 while the revenue generated using MS is approximately $6.5. On the other hand, when the number of servers is 100, the revenue generated using MRT is $6.5, while the revenue generated using MS is approximately $6.75.
Figure 1: Variation of revenue with number of servers.
Figure 2 shows the variation of revenue as a function of average arrival rate for Mean Response Time (MRT) and Mean Slowdown (MS) pricing mechanisms under FCFS policy. In doing this, we used equations 1, and 11 to plot the graph of revenue as a function of average arrival rate. To investigate the effect of increasing the arrival rate on revenue, we fix the number of servers, the service rate, and size of requests. We observe that revenue general increase with increase in average arrival rate regardless of the pricing mechanism. This is because as the average arrival rate increases, the number of requests served also increases and hence more revenue is generated. We further observe that more revenue is generated when MS pricing mechanism is used than when MRT pricing mechanism is used. For example when the arrival rate is 25 packets/second, the revenue generated using MRT is $8.0 while the revengenerated when MS is used is $8.2. The difference in revenue generated using MRT and MS is much more closer for lowe arriva rates and less closer as the arrival rate increases.
Figure 2: Variation of revenue with average arrival rate.
Figure 3 shows the variation of revenue as a function of number of servers for Instant Response Time (IRT) and Instant Slowdown (IS) pricing mechanisms under FCFS policy. In doing this, we used equations 2, and 30 to plot the graph of revenue as a function of number of servers. To investigate the effect of increasing the number of servers on revenue for the two pricinschemes, we fix the arrival rate, the service rate, and size of requests. We observe that revenue generally increases with increase in number of servers regardless of the pricing mechanism. This is because as the number of servers increase, the number of requests also increases and hence more revenue is generated. We further observe that more revenue is generated when IS pricing mechanism is used than when IRT pricing mechanism is used. The difference in revenue generated using IRT and IS is more pronounced for high number of servers as compared to low number of servers. For example, when the number of servers is 20, the revenue generated using IRT pricing mechanism is approximately $5.2 while the revenue generated using IS pricing mechanism is approximately $6.8. On the other hand, when the number of servers is 10, the revenue generated using IRT pricing mechanism is approximately $4.8, while the revenue generated using IS is approximately $5.9.
Figure 3: Variation of revenue with number of servers.
Figure 4 shows the variation of revenue as a function of arrival rate for Instant Response Time (IRT) and Instant Slowdown (IS) pricing mechanisms under FCFS policy. In doing this, we used equations 2, and 30 to plot the graph of revenue as a function of arrival rate. To investigate the effect of increasing the arrival rates on revenue for the two pricing schemes, we fix the number of servers, the service rate, and size of requests. We observe that revenue generally increases with increase in arrival rate regardless of the pricing mechanism used. This is because as the arrival rate increases, the number of requests into the system also increases and hence more revenue is generated. We further observe that more revenue is generated when IS pricing mechanism is used than when IRT pricing mechanism is used. For example, when the arrival rate is 8 packets/second, the revenue generated using IRT pricing mechanism is approximately $2.0 while the revenue generated using IS pricing mechanism is approximately $3.6. On the other hand, when the arrival rate is 18 packets/second, the revenue generated using IRT pricing mechanism is approximately $4.6, while the revenue generated using IS pricing mechanism is approximately $6.0.
Figure 4: Variation of revenue with arrival rate.
Figure 5 shows the variation of revenue as a function of number of servers for Mean Response Time(MRT) and Mean Slowdown (MS) pricing mechanisms under PS scheduling policy. In doing this, we used equations 43, and 58 to plot the graph of revenue as a function of number of servers. To investigate the effect of increasing the number of servers on revenue for the two pricing schemes, we fix the arrival rate, the service rate, and size of requests. We observe that revenue generally increases with increase in number of servers regardless of the pricing mechanism used. We further observe that more revenue is generated when MS pricing mechanism is used than when MRT pricing mechanism is used. For example, when the number of servers is 10, the revenue generated using MRT pricing mechanism is approximately $42.0, while the revenue generated using MS pricing mechanism is approximately $47.0. The difference in revenue generated using MS and MRT is higher for lower number of servers as compared to higher number of servers where the difference in revenue is less.
Figure 5: Variation of revenue with number of servers.
Figure 6 shows the variation of revenue as a function of arrival rate for Mean Response Time (MRT) and Mean Slowdown (MS) pricing mechanisms under PS scheduling policy. In doing this, we used equations 43, and 58 to plot the graph of revenue as a function of arrival rate. To investigate the effect of increasing the arrival rate on revenue for the two pricing schemes, we fix the number of servers, the service rate, and size of requests. We observe that revenue generally increases with increase in arrival rate regardless of the pricing mechanism used. This is because as the arrival rate increases, the number of requests into the system also increases and hence more revenue is generated. We further observe that more revenue is generated when MS pricing mechanism is used than when MRT pricing mechanism is used. 2) Comparison of FCFS and PS Policies in terms of MRT and MS: In this section, we investigate the variation of revenue with number of servers, and arrival rate of packets in the system under FCFS and PS policies.
Figure 6: Variation of revenue arrival rate.
Figure 7 shows the variation of revenue as a function of number of servers in terms of Mean Response Time (MRT) pricing mechanism under FCFS and PS scheduling policies. We used equations 1, and 43 to plot the graph of revenue as a function of number of servers. To investigate the effect of increasing the number of servers on revenue for the two scheduling policies, we fix the arrival rate, the service rate, and size of requests. We observe that revenue generally increases with increase in number of servers regardless of the scheduling policy used. However, when the number of servers is approximately 16, the revenue generated by the two scheduling schemes are equal. We further observe that if the number of servers is less than 16, FCFS policy generates more revenue than PS policy; however when the number of servers is greater than 16, PS policy generates more revenue than FCFS. For example, when the number of servers is 25, the revenue generated under FCFS policy is $5.0 while the revenue generated under PS policy is $10.0.
Figure 7: Variation of revenue with number of servers in terms of mean of response time.
Figure 8 shows the variation of revenue as a function of arrival rate in terms of Mean Response Time (MRT) pricing mechanism under FCFS and PS scheduling policies. We used equations 1, and 43 to plot the graph of revenue as a function of arrival rate. To investigate the effect of increasing the arrival rate on revenue for the two scheduling policies, we fix the number of servers, the service rate, and size of requests. We observe that revenue generated generally increases with increase in arrival rate regardless of the scheduling policy used. We further observe that PS scheduling policy generates more revenue than FCFS scheduling policy. For example, when the arrival rate is 10 packets/second, the revenue generated by FCFS policy is $1.2 whereas the revenue generated by PS policy is $1.3. On the other hand, when the arrival rate is 14 packets/second, the revenue generated under FCFS policy is $1.3 and under PS policy is approximately $1.5.
Figure 8: Variation of revenue with arrival rate in terms of mean of response time.
Figure 9 shows the variation of revenue as a function of number of servers for Mean Slowdown (MS) pricing mechanism under FCFS and PS scheduling policies. We used equations 11, and 58 to plot the graph of revenue as a function of number of servers. To investigate the effect of increasing the number of servers on revenue for the two scheduling policies in terms of mean slowdown, we fix the arrival rate, the service rate, and size of requests. We observe that revenue generally increases with increase in number of servers regardless of the scheduling policy used. We further observe that for low number of servers, FCFS policy generates more revenue than PS policy; however as the number of servers increase, PS policy generates more revenue than FCFS. For example, when the number of servers is 40, the revenue generated under the FCFS policy is $6.0 while the revenue generated under the PS policy is approximately $11.0. In addition, when the number of servers is approximately 20, the revenue generated by the two scheduling schemes is equal.
Figure 9: Variation of revenue with number of servers in terms of mean slowdown.
Figure 10 shows the variation of revenue as a function of arrival rate for Mean Slowdown (MS) pricing mechanism under FCFS and PS scheduling policies. We used equations 11, and 58 to plot the graph of revenue as a function of arrival rate. To investigate the effect of increasing the arrival rate on revenue for the two scheduling policies in terms of mean slowdown, we fix the number of servers, the service rate, and size of requests. We observe that revenue generally increases with increase in arrival rate regardless of the scheduling policy used. We further observe that PS scheduling policy generates more revenue than FCFS policy irrespective of the arrival rate. For example, when the arrival rate is 2 packets/second, the revenue generated under FCFS policy is approximately $0.35, while the revenue generated under PS policy is approximately $0.45.
Figure 10: Variation of revenue with arrival rate in terms of mean slowdown.
In the next section we compare IRT and IS pricing mechanisms under PS scheduling scheme. 3) Comparison of IRT and IS under PS: In this section we compare IRT and IS pricing mechanisms under PS scheduling scheme.
Figure 11 shows the variation of revenue as a function of number of servers for Instant Response Time (IRT) and Instant Slowdown (IS) pricing mechanisms under PS scheduling policy. We used equations 2, and 30 to plot the graph of revenue as a function of number of servers. To investigate the effect of increasing the number of servers on revenue for the two pricing schemes, we fix the arrival rate, the service rate, and size of requests. We observe that revenue generally increases with increase in number of servers regardless of the pricing mechanism used. We further observe that for low number of servers, IRT pricing mechanism generates more revenue than IS pricing mechanism, however as the number of servers increase, IS pricing mechanism generates more revenue than IRT pricing mechanism. In addition, the increase in revenue remains constant after deploying approximately 20 servers.
Figure 11: Variation of revenue with number of servers.
Figure 12 shows the variation of revenue as a function of arrival rate for Instant Response Time (IRT) and Instant Slowdown (IS) pricing mechanisms under PS scheduling policy. To investigate the effect of increasing the arrival rate on revenue for the two pricing schemes, we fix the service rate, the number of servers, and size of requests. We used equations 2, and 30 to plot the graph of revenue as a function of arrival rate. We observe that revenue generally increases with increase in arrival rate regardless of the pricing mechanism used. We further observe that IS pricing mechanism generates slightly more revenue than IRT pricing scheme. 4) Comparison of FCFS and PS Policies in terms of IRT: In this section, we evaluate the performance of FCFS and PS Policies under IRT pricing mechanism in terms of revenue generate.
Figure 12: Variation of revenue with arrival time.
Figure 13 shows the variation of revenue as a function of number of servers for Instant Response Time (IRT) pricing mechanism under FCFS and PS scheduling policies. We used equations 2, and 62 to plot the graph of revenue as a function of number of servers. To investigate the effect of increasing the number of servers on revenue for the two scheduling policies, we fix the arrival rate, the service rate, and size of requests. We observe that revenue generally increases with increase in number of servers regardless of the scheduling policy used. We further observe that PS scheduling policy generates more revenue than FCFS for all considered number of servers. In addition, the revenue generated for the PS scheduling policy almost remains constant after deploying 4 servers.
Figure 13: Variatiton of revenue with number of servers.
Figure 14 shows the variation of revenue as a function of arrival rate for Instant Response Time (IRT) pricing mechanism under FCFS and PS scheduling policies. We used equations 2, and 62 to plot the graph of revenue as a function of arrival rate. To investigate the effect of increasing the arrival rate on revenue for the two scheduling policies, we fix the number of servers, the service rate, and size of requests. We observe that revenue generally increases with increase in arrival rate irrespective of the scheduling policy used. We further observe that PS scheduling policy generates more revenue than FCFS for all considered arrival rate values. For example, when the arrival rate is 12 packets/second, the revenue generated under FCFS policy is approximately $3.1, while the revenue generated under PS policy is $4.0. The difference in revenue between PS and FCFS progressively increases as the arrival rate also increases. In the next section, we compare the performance of FCFS and PS Policies under IS pricing mechanism in terms of revenue generated. 5) Comparison of FCFS and PS Policies in terms of IS: In this section, we evaluate the performance of FCFS and PS Policies under IS pricing mechanism in terms of revenueGenerated.
Figure 14: Variation of revenue with mean arrival rate.
Figure 15 shows a graph of revenue against number of servers for Instant Slowdown (IS) pricing mechanism under FCFS and PS scheduling policies. We used equations 30, and 67 to plot the graph of revenue as a function of number of servers. To investigate the effect of increasing the number of servers on revenue for the two scheduling policies, we fix the arrival rate, the service rate, and size of requests. We observe that revenue generally increases with increase in number of servers irrespective of the scheduling policy used. We also observe that PS scheduling policy generates more revenue than FCFS for lower number of servers; however as the number of servers increase the revenue generated under the two policies become closer and finally become the same after deploying approximately 17 servers.
Figure 15: Variation of revenue with number of servers.
Figure 16 shows a graph of revenue against arrival rate for Instant Slowdown (IS) pricing mechanism under FCFS and PS scheduling policies. We used equations 30, and 67 to plot the graph of revenue as a function of arrival rate. To investigate the effect of increasing the arrival rate on revenue for the two scheduling policies, we fix the number of servers, the service rate, and size of requests. We observe that revenue generally increases with increase in number of servers irrespective of the scheduling policy used. We also observe that FCFS and PS scheduling policies generate almost the same revenue for all considered arrival rate values.
Figure 16: Variation of revenue with arrival rate.
Conclusion
Analytical models of pricing mechanisms are developed for cloud computing under FCFS and PS scheduling policies. The pricing mechanisms are based on mean slowdown and instant slowdown. The models are used to compare the performance of FCFS and PS scheduling policies in terms of revenue generated. The numerical results obtained from the derived models show that PS scheduling policy performs better than FCFS scheduling policy in terms of generating more revenue for higher number of servers, however when the number of servers is low, FCFS generates more revenue than PS. It is also observed that pricing mechanism based on Slowdown generates more revenue for the service provider than pricing mechanism based on response time. We also observe that generally revenue generated increases with increase in the number of servers, arrival rate and service rate regardless of the pricing mechanism used.
Acknowledgment
The authors would like to thank Makerere University for the financial support.
References
- Mell P, Grance T (2016) The NIST Definition of Cloud Computing, National Institute of Standards and Technology (NIST).
- Huth A, Cebula J (2011) “The Basics of Cloud Computing”. US-CERT.
- Forum WE (2010) “Exploring the future of cloud computing: Riding the next wave of technology-driven transformation,” World Economic Forum In partnership with Accenture Report, 179-208.
- Armbrust M, Fox A, Griffith R (2010) “A View of Cloud Computing,” Communications of the Acm 53: 50-58.
- Kleinrock L, John Wiley & Sons, (1976) Queueing Systems, Computer Applications. 2: 1.
- Almeida L, Fonseca J A (2001) “Analysis of a simple model for nonpreemptive blocking-free scheduling”.
- Feng G, Garg S, Buyya R, (2012) “Revenue Maximization Using Adaptive Resource Provisioning in Cloud Computing Environments”. ACM, 192-200.
- Rae B, (2016 ) “A Guide to SLAs,” retrieved.
- Kleinrock L (1975) Queueing Systems. 1: 167-230.
- Li H, Muskulus M (2007) “Analysis and modeling of job arrivals in a production grid,” in Proc. SIGMETRICS Perform. Eval Rev 34: 4.
- Buyya R, Broberg J, A Goscinski (2011) Introduction to Cloud Computing: Principles and Paradigms.
- Yeoa CS, Venugopalb S, Chua X (2010) “Autonomic Metered Pricing for a Utility Computing Service,” in Proc. Future Generation Computer Syst 2010, 26: 8.
- Mihailescu M, Teo YM (2010) “Dynamic resource pricing on federated clouds,” in Proc. IEEE International Symposium on Cluster, Cloud and Grid Computing, 513-517.
- Zhu H, Tang H, Yang T (2001) “Demand-driven Service Differentiation in Cluster-based Network Servers.”, 679-688.
- Mazzucco M (2009) “Revenue Maximization Problems in Commercial Data Centers”.
- Wierman (2017) “Scheduling for Todays Computer Systems: Bridging Theory and Practice.”
- Downey (1997) “A parallel workload model and its implications for processor allocation.” 112-123.
- Rai (2004) “QoS Support in Edge Routers.
- Wierman (2007) “Scheduling for today’s computer systems: Bridging theory and practice.”
- Rai G, Urvoy Keller, Biersack E “Analysis of LAS Scheduling for Job Size Distributions with High Variance.” in Proc. ACM SIGMETRICS, 2003, 218-228.
- Villela P, Pradhan, D Rubenstein, “Provisioning Servers in the Application Tier for E-Commerce Systems.” 2007, 57-66.