Aaron Rohr1*, Benjamin Haverkamp2, William Pedersen3, Joseph Vavricek4, Saad Iqbal5, Jill Jones1, Thomas Fahrbach1, Suzanne Hunt6, Jo Wick6, Carissa Walter1, Jacqueline Hill1 and Zachary Collins1
1Department of Radiology, University of Kansas Medical Center, Kansas City, Kansas, USA
2United Imaging Consultants of Kansas City, Lee’s Summit, Missouri, USA
3Department of Radiology, University of Pittsburg Medical Center, Pittsburg, Pennsylvania, USA
4Mercy Medical Center, Des Moines, Iowa, USA
5United Northeast Radiology, Kingwood, Texas, USA
6Department of Biostatistics, University of Kansas Medical Center, Kansas City, Kansas, USA
*Corresponding Author:
Aaron Rohr
Department of Radiology
University of Kansas Medical Center
3901 Rainbow Boulevard, Mail Stop 4032
Kansas City, Kansas 66160, USA
Tel: 913-588-1847
Fax: 913-945-6687
E-mail: arohr@kumc.edu
Received Date: November 23, 2017; Accepted Date: November 30, 2017; Published Date: December 07, 2017
Citation: Rohr A, Haverkamp B, Pedersen W, Vavricek J, Iqbal S, et al. (2017) Retrospective Review of Tumor Response to Glass and Resin Y-90 Microsphere Treatments in Patients with Hepatocellular Carcinoma. Res J Oncol. Vol.1 No.1:8
Keywords
Hepatocellular carcinoma; Radioembolization; Y-90; Tumor
Introduction
Hepatocellular carcinoma (HCC), an aggressive liver tumor, usually occurs in the setting of cirrhosis, which is commonly the result of viral hepatitis, alcohol abuse, or non-alcoholic steatohepatitis (NASH). Surgical resection, ablative techniques, and liver transplantation may definitively cure HCC [1-3]. However, in patients for whom these treatments are not options, transarterial radioembolization utilizing yttrium-90 (Y-90) is an established therapy that can delay progression of HCC [4]. Additionally, radioembolization may be used to stabilize disease in patients awaiting transplant, or reduce overall disease burden for patients who are currently ineligible for liver transplantation [5,6].
Radioembolization dually treats liver tumors by delivering a cytotoxic dose of radiation and restricting arterial blood supply with embolization. Currently, there are two Y-90 delivery methods, via glass and resin beads, that are widely available in the United States for use in catheter-directed radioembolization therapy. Glass beads (20-30 micron) are smaller in size than resin beads (20-60 micron), but deliver a much larger activity per bead (2,500 Bq vs 50 Bq, respectively), while resin beads tend to produce greater degrees of embolization [7].
Debate on the relative importance of the radiation effect versus the embolic effect continues in the interventional oncology community, as limited head-to-head comparisons of the two methods have demonstrated conflicting tumor control rates in HCC patients [8,9]. Prior research examining tumor response for these two treatment types in patients with portal vein invasion (PVI), has shown the superiority of glass beads when PVI is present [8]. Because resin Y-90 treatments contain more spheres per dose, they have the capacity to generate a greater embolic effect, resulting in ischemia that may lead to diminished hepatic function [8].
Although glass and resin Y-90 therapies have independently been associated with improved patient outcomes, direct comparison of the two delivery methods has not clearly established the superiority of either method in HCC patients with portal vein thrombosis [9,10]. Therefore, this study was designed to directly compare tumor response, TTP, and PFS outcomes in HCC patients who received Y-90 therapy. Secondary investigation by PVI status was also performed to further evaluate previous findings.
Materials and Methods
A single center, retrospective analysis was conducted on all patients with hepatocellular carcinoma (HCC) who received either glass (known as TheraSphere® manufactured by BTG Biocompatibles Ltd, Farnham, United Kingdom) or resin (known as SIR-Spheres® manufactured by Sirtex Medical, Sydney, Australia) Y-90 radioembolization treatment of liver tumors at our institution between January 1, 2008 and June 30, 2014. Patients were required to have contrast-enhanced cross-sectional (CT or MRI) baseline imaging, and one or more contrast-enhanced follow-up imaging studies available to measure tumor response to treatment. Eleven patients were excluded for missing treatment or imaging data and three for receiving combination transarterial chemoembolization (TACE) treatment. Approval was obtained from the institutional review board (IRB) to review patient medical records. Patient demographic, clinical, treatment, and imaging data were gathered from electronic medical records and the Picture Archiving and Communication System (PACS). Study data was collected and managed using REDCap electronic data capture tools [11].
As part of the clinical administration of Y-90 microspheres at our institution, all patients underwent hepatic angiograms approximately four weeks prior to treatment to map the hepatic arterial system, identify anatomic variants, determine tumoral blood supply, and embolize vessels that could allow microspheres to enter the gastrointestinal tract. To assess safety of the upcoming Y-90 procedure, macroaggregated albumin (MAA) was delivered via the hepatic artery, followed by the use of single-photon emission computed tomography (SPECT) gamma imaging to detect shunting of particles through large intra-tumoral arteriovenous shunts into the gastrointestinal or pulmonary systems [12]. Once the procedure was deemed safe, patients returned within approximately four weeks for catheterdirected angiographic treatment with either glass or resin Y-90 microspheres. Glass treatments are based on the partition model with a goal dose of 120 GY to the liver and calculated using the standard treatment window illustrator (BTG Biocompatibles Ltd). Resin treatments are based on the body surface area (BSA) method and calculated using the SMAC (SIR-Spheres Microspheres Activity Calculator, Sirtex Medical). Both dosing calculations account for patient lung shunt fraction. Following treatment, patients underwent follow-up CT or MR imaging at approximately one and six months to monitor tumor response.
Tumor response, time-to-progression (TTP), and progressionfree survival (PFS) outcomes were compared between glass and resin Y-90 treatment groups and by PVI status. Participants were grouped based on the type of Y-90 treatment they received for their first treatment. Patients with any amount of PVI were classified as having PVI by the interventional radiologist.
Tumor response to treatment was evaluated by visual estimation using all available contrast-enhanced cross-sectional studies until death or loss to follow-up using the modified Response Evaluation Criteria in Solid Tumors (mRECIST) criteria [13]. Tumor response was evaluated on each available follow-up imaging study by three trained independent readers who had completed diagnostic radiology residencies – two interventional radiology fellows and one body imaging fellow. Tumor response was classified as “complete response” (CR; 100% decrease in enhancing tissue from baseline imaging), “partial response” (PR; ≥ 30% decrease in enhancing tissue from baseline), “stable disease” (SD; <30% decrease in enhancing tissue or 1-19% increase in enhancing tissue from baseline), or “progressive disease” (PD; 20% or more increase in enhancing tissue or presence of new lesions from baseline) [13]. Agreement between at least two readers was required for a definitive response conclusion. In cases where all three readers disagreed, they met to discuss the case until a final consensus was reached.
TTP was measured from the date of diagnosis to the date of the first imaging study indicating tumor progression. PFS was measured from the date of first treatment to the date of the first imaging study indicating tumor progression. The reference date used in TTP calculations was date of diagnosis, while date of death was used in PFS calculations. Patients without observed progression were censored at the following time points: 1) 365 days after reference date if no observed progression, 2) date of death if occurred within 365 days, and 3) date of last contact if no observed progression within 365 days. Glass treatments were used nearly three years before resin treatments at our institution. Thus, patients were censored at 365 days after first treatment date to minimize potential confounding of longer observation periods in a retrospective analysis (e.g., patients who received treatments at the beginning of the study period were potentially observed for a longer period of time, which may provide more opportunities to observed progression events). Patients who died were censored at date of death because of a lack of direct evidence that death was related to progression of their HCC.
Patient and treatment characteristics were summarized using basic descriptive statistics and compared using Wilcoxon Rank Sum, Wilcoxon-Mann-Whitney, and t-tests for continuous variables and Fisher’s Exact and chi-square tests for categorical variables. Tumor response was assessed using logistic regression and odds ratios (ORs), while TTP and PFS were assessed using Kaplan-Meier curves, log-rank tests, and hazard ratios (HRs) [14]. Statistical analysis was performed using SAS software version 9.4 (SAS Institute Inc., Cary, NC) and statistical significance was determined using p-values <0.05.
Results
Forty-eight patients were included in this study. The majority were white (75.0%), non-Hispanic (97.9%), and male (81.3%), with a median age at their first Y-90 treatment of 60 years (range = 51-82; Table 1). The most common liver disease diagnoses were cirrhosis (72.9%), hepatitis C (41.7%), and alcoholic liver disease (29.2%). At the first Y-90 treatment, half of all patients had 25-50% of their liver invaded by tumor, and 58.3% exhibited PVI. Prior to the first Y-90 treatment, 37.5% of patients had not received any other therapy, whereas one-third had received Sorafenib and one-third received TACE treatments. Characteristics between patients in both treatment groups were statistically comparable, although median alpha-fetoprotein (AFP, p=0.18), aspartate aminotransferase (AST, p=0.02), and total bilirubin (p=0.05) levels exhibiting meaningful clinical differences.
Table 1 Participant characteristics by Y-90 treatment type.
| Characteristic |
All
(n=48) |
Glass Treatment
(n=28) |
Resin Treatment
(n=20) |
p-value |
| Median Age at First Treatment, years (range) |
60 (51-82) |
61 (51-79) |
59 (51-82) |
0.65 |
| Gender, n (%) |
|
|
|
0.46 |
| Female |
9 (18.8) |
4 (14.3) |
5 (25.0) |
|
| Male |
39 (81.3) |
24 (85.7) |
15 (75.0) |
|
| Ethnicity, n (%) |
|
|
|
0.42 |
| Non-Hispanic/Latino |
47 (97.9) |
28 (100) |
19 (95) |
|
| Hispanic/Latino |
1 (2.1) |
- |
1 (5.0) |
|
| Race, n (%) |
|
|
|
0.1 |
| White |
36 (75.0) |
23 (82.1) |
13 (65.5) |
|
| Black |
9 (18.8) |
5 (17.9) |
4 (20.0) |
|
| Other |
3 (6.3) |
- |
3 (15.0) |
|
| Liver Disease*, n (%) |
|
|
|
|
| None |
8 (16.7) |
4 (14.3) |
4 (20.0) |
0.7 |
| Cirrhosis |
35 (72.9) |
22 (78.6) |
13 (65.5) |
0.34 |
| Hepatitis C |
20 (41.7) |
10 (35.7) |
10 (50.0) |
0.38 |
| Alcoholic Liver Disease |
14 (29.2) |
10 (35.7) |
4 (15.0) |
0.34 |
| Hepatitis B |
4 (8.3) |
3 (10.7) |
1 (5.0) |
n/a |
| Unspecified Hepatitis |
1 (2.1) |
1 (3.6) |
- |
n/a |
| Non-Alcoholic Fatty Liver Disease |
1 (2.1) |
1 (3.6) |
- |
n/a |
| Percent of Liver Invaded by Tumor, n (%) |
|
|
|
0.55 |
| <25% |
20 (41.7) |
13 (46.4) |
7 (35.0) |
|
| 25-50% |
24 (50.0) |
12 (42.9) |
12 (60.0) |
|
| >50% |
4 (8.3) |
3 (10.7) |
1 (5.0) |
|
| Presence of Portal Invasion (PVI) |
|
|
|
0.76 |
| Yes |
28 (58.3) |
16 (57.1) |
12 (60.0) |
|
| No |
20 (41.7) |
12 (42.9) |
8 (40.0) |
|
| Median Pre-Treatment Lab Values (range) |
|
|
|
|
| AFP, ng/mL |
189 |
390 |
25 (1-7923) |
0.18 |
| |
(1- 277651) |
(2-277651) |
|
|
| ALT, u/L |
38 (12-158) |
44 (12-140) |
35 (16-158) |
0.38 |
| ALP, u/L |
139 (40-518) |
162 (40-518) |
123 (62-465) |
0.33 |
| AST, u/L |
60 (19-265) |
74 (28-265) |
49 (19-132) |
0.02 |
| CEA, ng/mL |
6.4 (2.4-70.0) |
3.8 (2.4-70.0) |
7.0 (6.4-7.5) |
0.79 |
| Creatinine, mg/dL |
0.9 (0.5-9.7) |
0.9 (0.6-9.7) |
0.9 (0.5-2.3) |
0.92 |
| Total Bilirubin, mg/dL |
1.0 (0.2-2.0) |
1.1 (0.5-2.0) |
0.8 (0.2-2.0) |
0.05 |
| MELD Score |
10 (6-29) |
9 (7-29) |
10 (6-15) |
0.89 |
| Prior Therapies*, n (%) |
|
|
|
| None |
18 (37.5) |
10 (35.7) |
8 (40.0) |
0.76 |
| Sorafenib |
16 (33.3) |
12 (42.9) |
4 (20.0) |
n/a |
| Regorafenib |
- |
- |
- |
n/a |
| Other Chemotherapy |
1 (2.1) |
- |
1 (5.0) |
n/a |
| TACE |
16 (33.3) |
8 (28.6) |
8 (40.0) |
0.41 |
| MWA |
4 (8.3) |
3 (10.7) |
1 (5.0) |
n/a |
* Participants may have had more than one type of liver disease or prior therapy.
AST=aspartate aminotransferase, AFP= alpha-fetoprotein, ALT=alanine aminotransferase, ALP=alkaline phosphatase, CEA= carcinoembryonic antigen, MELD=model for end-stage liver disease, TACE=transarterial chemoembolization, MWA=microwave ablation
Forty-eight patients received a total of 78 Y-90 treatments (Table 2). The majority of patients (58.3%, n=28) received treatment with glass microspheres, while the remaining 41.7% (n=20) received treatment with resin microspheres. When using manufacturers’ recommended dosing methods, median administered Y-90 activity across all treatments was 3.8 GBq (range=1.0-9.0) for glass and 1.4 GBq (range=1.0-3.0) for resin groups. Twenty-seven patients received only one Y-90 treatment, with a median time from diagnosis to Treatment 1 of 116 days. The median time between Treatments 1 and 2 was 40 days (range=20-412), but was significantly longer for patients receiving glass compared to resin treatment (p=0.01). Median follow-up time for TTP was 365.0 days for both glass and resin groups, while median followup time for PFS was 206.0 days (range=32.0-365.0 days) for glass and 314.0 days (range=56.0-365.0 days) for resin (p=0.10).
Table 2 Y-90 treatment course by treatment type.
Treatment Course |
All
(n=48) |
Glass Treatment
(n=28) |
Resin Treatment
(n=20) |
p-value |
| Median Number of Treatments (range) |
1 (1-3) |
1 (1-3) |
1.5 (1-3) |
0.55 |
| Total Number of Y-90 Treatments, n (%) |
|
|
|
n/a |
| 1 |
27 (56.3) |
17 (60.7) |
10 (50.0) |
|
| 2 |
18 (20.8) |
9 (32.1) |
9 (45.0) |
|
| 3 |
3 (6.2) |
2 (7.1) |
1 (5.0) |
|
| Median Administered Y-90 Activity (GBq) Across All Treatments (range) |
n/a |
3.8 (1.0-9.0) |
1.4 (1.0-3.0) |
0.01 |
| Median Days from Diagnosis to Treatment 1 (range) |
116 (0-1004) |
132 (0-1004) |
78 (0-920) |
0.66 |
| Median Days from Treatment 1 to 2 (range) |
40 (20-412) |
78 (30-412) |
29 (20-133) |
0.01 |
| Median Days from Treatment 2 to 3 (range) |
182 (118-350) |
266 (182-350) |
118 (118-118) |
n/a |
| Median Follow-Up Days for TTP (range)* |
365 |
365 |
365 |
1 |
| |
(32.0-365.0) |
(32.0-365.0) |
(56.0-365.0) |
|
| Median Follow-Up Days for PFS (range)* |
237 |
206 |
314 |
0.1 |
| |
(32.0-365.0) |
(32.0-365.0) |
(56.0-365.0) |
|
* The reference date used in TTP calculations was date of diagnosis, while PFS calculations used date of death.
There was no significant difference in the distribution of tumor responses by treatment group or PVI (Table 3). Overall, 67.9% of patients in the glass group and 80.0% of patients in the resin group demonstrated disease control (CR, PR, or SD; OR=1.9, 95% CI=0.5-8.1). Tumor responses varied by PVI status, as 62.5% of glass and 91.7% of resin patients with PVI (OR=6.6, 95% CI=0.9- 136.3) and 75.0% of glass and 62.5% of resin patients without PVI (OR=0.6, 95% CI=0.1-4.0) demonstrated disease control.
Table 3 Odds ratios for controlled disease by Y-90 treatment type.
| Treatment Type |
All |
Controlled Disease
(CR, PR, SD) |
Progressed Disease (PD) |
Odds Ratio (95% CI) |
| All Patients, n (%) |
48 (100.0) |
35 (83.3) |
13 (16.7) |
|
| Glass |
28 (58.3) |
19 (67.9) |
9 (32.1) |
reference |
| Resin |
20 (41.7) |
16 (80.0) |
4 (20.0) |
1.9 (0.5-8.1) |
| Patients with PVI, n (%) |
28 (58.3) |
23 (57.5) |
5 (62.5) |
|
| Glass, n (%) |
16 (57.1) |
10 (62.5) |
6 (37.5) |
reference |
| Resin, n (%) |
12 (42.9) |
11 (91.7) |
1 (8.3) |
6.6 (0.9-136.3) |
| Patients without PVI, n (%) |
20 (41.7) |
17 (42.5) |
3 (37.5) |
|
| Glass, n (%) |
12 (60.0) |
9 (75.0) |
3 (25.0) |
reference |
| Resin, n (%) |
8 (40.0) |
5 (62.5) |
3 (37.5) |
0.6 (0.1-4.0) |
CR = complete response, PR = partial response, SD = stable disease, PD = progressive disease
Additionally, there were no significant differences in mean TTP or PFS between treatment groups. Mean TTP was 319.4 days (SD=16.8) for the glass group and 180.9 days (SD=3.0) for the resin group (HR=0.89, 95% CI=0.21-3.72, p=0.87) (Table 4 and Figure 1). Mean PFS was 135.5 days (SD=12.0) for the glass group and 173.0 days (SD=7.5) for the resin group (HR=0.52, 95% CI=0.16- 1.68, p=0.27) (Table 5 and Figure 2). In the TTP calculations, eight patients progressed – three resin (15.0%) and five (17.9%) glass. Forty patients were censored for death (n=11), loss to follow-up (n=2), and completed follow-up (n=27). In the PFS calculations, 13 patients progressed – four resin (20.0%) and nine (32.1%) glass. Thirty-five were censored for death (n=20), loss to followup (n=2) and completed follow-up (n=11).
Table 4 Time-to-progression (TTP) using mRECISTcriteria by Y-90 treatment type.
| Treatment Group |
Progressed,
n (%) |
Subjects Censored, n (%) |
Estimated Mean TTP,
days (SE) |
HR
(95% CI) |
p-value* |
| Died |
Lost to Follow-Up |
Completed Follow-Up |
Percent Censored |
| Glass (n=28) |
5 (17.9) |
7 (25.0) |
- |
16 (57.1) |
82.1 |
319.4
(16.8) |
0.89
(0.21-3.72) |
0.87 |
| Resin (n=20) |
3 (15.0) |
4 (20.0) |
2 (10.0) |
11 (55.0) |
85 |
180.9
(3.0) |
reference |
* Log-rank test was performed. There is not a statistically significant difference in TTP between treatment groups when followed for one year.
Table 5 Progression-free survival (PFS) using mRECISTcriteria by Y-90 treatment type.
| Treatment Group |
Progressed,
n (%) |
Subjects Censored, n (%) |
Estimated Mean PFS,
days (SE) |
HR
(95% CI) |
p-value* |
| Died |
Lost to Follow-Up |
Completed Follow-Up |
Percent Censored |
| Glass (n=28) |
9 (32.1) |
13 (46.4) |
- |
6 (25.0) |
67.9 |
135.5 (12.0) |
0.52
(0.16-1.68) |
0.27 |
| Resin (n=20) |
4 (20.0) |
7 (35.0) |
2 (10.0) |
7 (35.0) |
75 |
173
(7.5) |
reference |
* Log-rank test was performed. There is not a statistically significant difference in PFS between treatment groups when followed for one year.
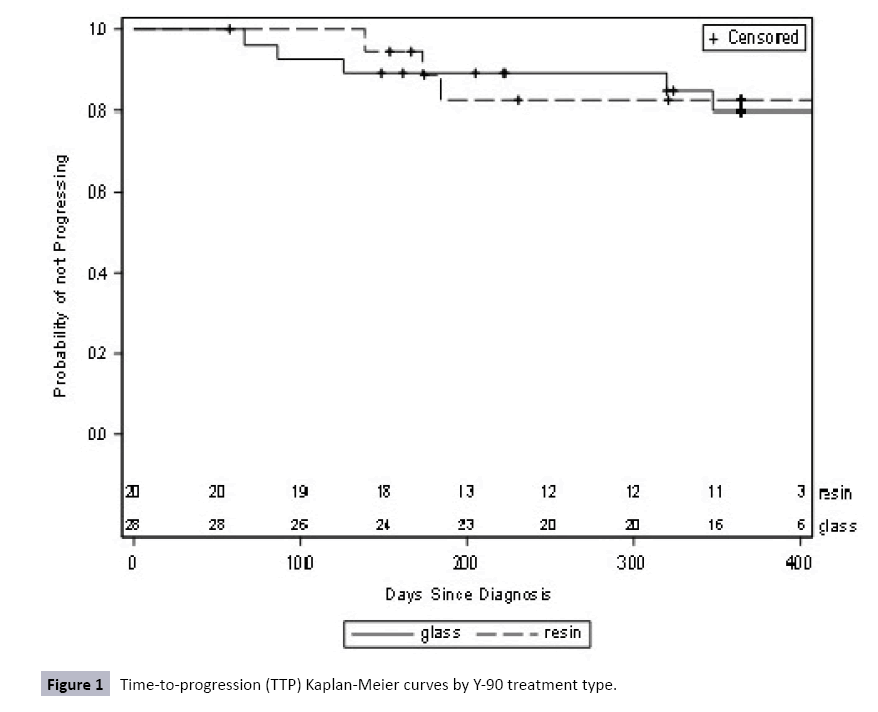
Figure 1: Time-to-progression (TTP) Kaplan-Meier curves by Y-90 treatment type.
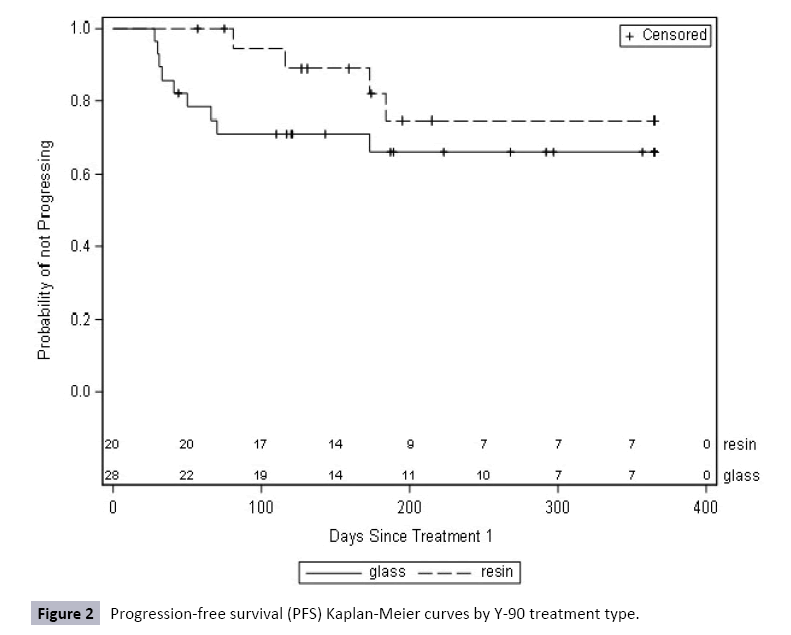
Figure 2: Progression-free survival (PFS) Kaplan-Meier curves by Y-90 treatment type.
Discussion
This retrospective analysis of patients with HCC who received Y-90 treatments from 2008-2014 found no significant differences in tumor response by treatment group or PVI. Patients demonstrated overall tumor control rates of 67.9% and 80.0% in glass and resin treatment groups, respectively, with similar rates for patients with and without PVI. Moreover, there were also no statistically significant differences in mean TTP (319.4 vs. 180.9 days, respectively) or PFS (135.5 vs. 173.0 days, respectively) between glass and resin treatment groups up to one year after first Y-90 treatment. However, these differences in TTP and PFS are likely clinically significant for patients, but were limited by small sample size.
Research directly comparing tumor response in patients who received glass and resin Y-90 treatments is limited. In a metaanalysis involving 318 HCC patients, researchers documented statistically significant differences in tumor control rates for patients receiving glass and resin treatments, with 78% demonstrating control for glass and 89% for resin (p=0.02) [7]. Although the current study demonstrated the same tumor control rates for patients receiving glass (78.6%) and resin (90.0%) treatments, the small sample size limited the ability to document significance. Moreover, when examining 90 patients with HCC and PVI who received Y-90 treatments (69 glass, 21 resin), Biederman et al. found no significant differences in tumor control between patients receiving glass (54.5%) and resin (37.5%) treatments (p=0.39). Although the tumor control rates in the current study for patients with HCC and PVI (75.0% for glass and 91.7% for resin treatments) were much higher than Biederman et al. the small sample size and low number of progressive disease events limited the ability to detect significance [8].
Similar to this current study, other prior research has also reported non-significant differences in TTP and PFS between glass and resin treatment groups. In the Biederman et al. study, differences in median TTP were not significant between treatment groups for patients with HCC and PVI at 5.9 months for glass compared to 2.8 months for resin treatments (p=0.48); PFS was not reported [8]. Similarly, in a retrospective analysis of 77 HCC patients (36 glass, 44 resin), Van Der Gucht et al. reported non-significant differences in PFS for patients receiving resin (6.1 months) compared to glass treatments (5.0 months, p=0.53); TTP was not reported [8,15].
This study is not without limitations. First, although all patients with HCC who received Y-90 treatments at this institution were included, the size of the patient population limited the ability to detect meaningful differences in tumor response, TTP, and PFS between treatment groups. The small sample size, in addition to the relatively low number of progressive disease events (six glass and two resin patients), contributed to wide confidence intervals, which further limited the ability to detect statistically significant differences (e.g., increased the potential for a type II error). Second, this study was also restricted to only the available data for a single-center retrospective analysis, as treatments or follow-up scans at outside intuitions were not captured. One strength of this study, however, is that it is one of the first to assess tumor response, TTP, and PFS outcomes in HCC patients by both treatment group and PVI status. Finally, although there were few statically significant differences between the glass and resin patient populations, differences in AFP, AST and total bilirubin may suggest that the glass group may have been slightly sicker than the resin group. Future research should build upon this concept by performing prospective, randomized trials to more comprehensively collect treatment and follow-up data to best measure tumor response by treatment type and PVI.
Understanding differences in tumor response between glass and resin Y-90 treatments for patients with HCC is an important topic that remains poorly researched to-date. Although delivery methods and treatment goals are the same for both types of treatments, glass beads are slightly smaller and produce more radioactivity per bead than resin beads [7]. This difference in radioactivity also translates into a difference in the number of beads needed to achieve the same radioactive dose, with <5 million glass beads used per treatment compared to 10-30 million resin beads per treatment [16]. Resin treatments likely generate greater embolic effects than glass treatments, which may enhance tumor response and contribute to differences in treatments. However, this macroscopic embolic effect may also halt treatment if stasis is achieved before the full dose is delivered or contribute to the development of post-embolization syndrome.
Conclusion
In sum, this study found no statistically significant differences in tumor response, TTP, or PFS by Y-90 treatment group or presence of PVI. However, this may have been primarily attributable to a small sample size, as tumor control rates were similar to those in prior significant studies. Given the current limited research on this topic, the treatment decision-making process may need to incorporate discussions about the known inherent differences between glass and resin beads when determining the best treatment choice for patients. In order to better understand the full potential of Y-90 treatment in patients with HCC, future research should investigate the potential effect of treatment type and PVI through larger multi-center, prospective studies.
References
- Byam J, Renz J, Millis JM (2013) Liver transplantation for hepatocellular carcinoma. Hepatobiliary Surg Nutr 2: 22-30.
- Fong Y, Sun RL, Jarnagin W, Blumgart LH (1999) An analysis of 412 cases of hepatocellular carcinoma at a Western center. Ann Surg 229:790-799.
- Forner A, Llovet JM, Bruix J (2012) Hepatocellular carcinoma. Lancet 379:1245-1255.
- Salem R, Lewandowski RJ, Mulcahy MF, Riaz A, Ryu RK, et al. (2010) Radioembolization for hepatocellular carcinoma using Yttrium-90 microspheres: a comprehensive report of long-term outcomes. Gastroenterology 138:52-64.
- Sakaria SS, Dhanasekaran R, Pankonin M, Parekh S, Kauh JS, et al. (2009) Locoregional therapies as a bridge to transplant in patients with hepatocellular carcinoma. J Clin Oncol 27:e15608.
- Tohme S, Sukato D, Chen HW, Amesur N, Zajko AB, et al. (2013) Yttrium-90 radioembolization as a bridge to liver transplantation: A single-institution experience. J Vasc Interv Radiol 24:1632-1638.
- Sacco R, Conte C, Tumino E, Parisi G, Marceglia S, et al. (2016) Transarterial radioembolization for hepatocellular carcinoma: a review. J Hepatocell Carcinoma 3:25-29.
- Biederman DM, Titano JJ, Bishay VL, Durrani RJ, Dayan E, et al. (2016) Radiation segmentectomy versus TACE combined with microwave ablation for unresectable solitary hepatocellular carcinoma upto 3cm: A propensity score matching study. Radiology 283: 895-905.
- Vente MA, Wondergem M, van der Tweel I, van den Bosch MA, Zonnenberg BA, et al. (2009) Yttrium-90 microsphere radioembolization for the treatment of liver malignancies: a structured meta-analysis. Eur Radiol 19:951-959.
- Vouche M, Habib A, Ward TJ, Kim E, Kulik L, et al. Unresectable solitary hepatocellular carcinoma not amenable to radiofrequency ablation: multicenter radiology-pathology correlation and survival of radiation segmentectomy. Hepatology60:192-201.
- Harris PA, Taylor R, Thielke R, Payne J, Gonzalez N, et al. (2009) Research electronic data capture (REDCap) – A metadata-driven methodology and workflow process for providing translational research informatics support. Biomed Inform 42:377-381.
- Kallini JR, Gabr A, Salem R, Lewandowski RJ (2016) Transarterial radioembolization with Yttrium-90 for the treatment of hepatocellular carcinoma. Adv Ther33:699-714
- Lencioni R, Llovet JM (2010) Modified RECIST (mRECIST) assessment for hepatocellular carcinoma. Semin Liver Dis 30:52-60.
- Jakobs TF, Hoffmann RT, Dehm K, Trumm C, Stemmler HJ, et al. (2008) Hepatic Yttrium-90 radioembolization of chemotherapy-refractory colorectal cancer liver metastases. J Vas Int Rad 19:1187-1195.
- Van Der Gucht A, Jreige M, Denys A, Blanc DP, Boubaker A, et al. (2017) Resin versus glass microspheres for Yttrium-90 transarterial radioembolization: Comparing survival in unresectable hepatocellular carcinoma using pretreatment partition model dosimetry. J Nuc Med 58:1334-1340.
- Mosconi C, Cappelli A, Pettinato C, Golfieri R (2015) Radioembolization with Yttrium-90 microspheres in hepatocellular carcinoma: Role and perspectives. World J Hepat 7:738-752.