Keywords
Multiple regression model, Polynomial regression modeling, Root mean squared
error, R-squared, Allelopathy, Topsoil extracts.
Introduction
Allelopathy is a natural phenomenon
whereby one plant releases a substance
which has inhibitory and stimulatory effects
on other plants and micro organisms sharing
the same habitat [1,2] . A large number of
plants have been identified as being
allelopathic, and one of which is Tectona grandis Linn (Teak). The soil supporting the growth of teak have been found to contain
maximum levels of exchangeable calcium
and potassium [3,4] the absence of which can
result in restricted growth of roots, stems,
leaves and many other parts of the plant [5].
Allelopathic chemicals found in teak can be
present in any part of the plant in addition to the surrounding soil. Recently, the
allelopathic influence of leaf extracts on
some plants has been reported [6,7,8]. Extracts
from the seed and bark have also been used
as antifeedant, larvicidal and growth
inhibitors [9,10]. Extensive study has also
showed that the presence of allelopathy is
mainly demonstrated through symptoms
such as plant damage, low germination,
growth or development; presence of
substances or organisms (plants or
microbes) which contain or have the ability
to produce phytotoxic chemicals in the
vicinity of affected plants; the presence of
phytotoxic chemicals in the plants or extract
soils in the vicinity of affected plants [11]. The
source of allelopathic compounds especially
in soils has been traced to leaching, root
exudation, microbial decomposition and
enzymatic degradation of allelopathic plant
material [1] . Most allelochemicals are
classified as secondary metabolites of the
plant [12] and once they are dispatched in the
soil, they enter the complex plant - soil
system where diverse factors act on their
accumulation, availability and eventually
their effective influence on target plants. It is
to investigate further the transferability of
concentration dependent stimulatory or
inhibitory effect of allelochemical - laden
extract of top soil from teak plantation that
this research was conducted [13,14] . Ref
investigated the allelopathic effects present
in transferred topsoil extracts of T. grandis on lycopersicum esculentum seed
germination and growth of the seedling. The
allelopathic influence increased with
increasing mass of topsoil sample used.
Mathematical modelling is making
increasingly significant contributions among
the disciplines involved in allelopathy
research. The fundamentals of allelopathy
were expounded by An et al [18], following from that the authors in [19] studied plant
residue alleopathy. Separating allelopathy
from competition, characterizing allelopathy
and its ecological roles and the modeling of
allelopathy effects by external factors, like
density of target plants have recently been
studied in [15,16,17,26]. The use of nonlinear
regression models like log-logistic in
allelopathy modeling has been introduced by
Belz et al in [27].
In the study of allelopathy, biological
responses to allelochemical are frequently
expressed as percent of control. With the
control set at 100% it is, therefore
hypothesized that the biological response to
allelochemical, P% of control, is
mathematically expressed by the following
model:
P=100+s-1 (1)
Where P represents the biological
response to an allelochemical, S and I are
biological responses to the stimulatory and
inhibitory attributes of the allelochemical
respectively, and are expressed in the model
by enzyme kinetics [18] . This model has
provided the platform for the analysis of
experimental data, prediction of allelopathic
effects on plants and for theoretical
exploration of “fundamentals of allelopathy
matters” [15]
In this work polynomial modeling
will be used to interpolate the influence of
allelopathy of top soil of T. grandis on
lycopersicum esculentum seed germination
or seedling growth, the curvilinear
relationship between the two variables of the
data collected as seen in Figure 1 is the basis
for the use of this model. Polynomials are
mostly used in modeling a nonlinear
relationship between a response variable and
an explanatory variable. Polynomials are
“useful for interpolation, but notoriously
poor at extrapolation” [20] . In this research we do not intend to extrapolate but the
model could be use minimally for
extrapolation purposes.
Figure 1: The variation of mean percentage germination with mass of topsoil extract
Materials and Methods
Location of the experiment
The experiment was carried out at
the Crops and Soil Science Department
farm, College of Agriculture Education,
University of Education, Winneba,
Mampong - Ashanti (Longitude 0.05° and
1.30° W and Latitude 6.55° and 7.30° N), in
August, 2014. The soil at the farm was
largely sandy loam.
Land and sample preparation
A plot of land measuring 20m by
30m was prepared and divided into fifteen
mini - plots each with three sections for the
study. Fourteen of the mini - plots were
selected for the treatments and the remaining
was the control and respectively labelled
from A to O. Topsoil samples were collected
from a teak plantation, crushed into fine
powder and weighed into 0.5kg, 1kg, 1.5kg,
2.0kg, 2.5kg, 3.0kg, 3.5kg, 4.0kg, 4.5kg,
5.0kg, 5.5kg, 6.0kg, 6.5kg and 7.0kg packs.
The seeds of a local variety of tomato
(Power Rano) were obtained from a certified
seed supplier.
Treatment with the topsoil samples
Starting with the mini - plot marked
A, fifty (50) tomato seeds were sown on
each of the three sections after which 0.5 kg
of topsoil sample was spread fully, by
broadcasting, on each plot. The method was
repeated using the remaining mini - plots B -
N with respectively 1kg, 1.5kg, 2.0kg,
2.5kg, 3.0kg, 3.5kg, 4.0kg, 4.5kg, 5.0kg,
5.5kg, 6.0kg, 6.5kg and 7.0kg of the
samples. Fifty (50) seeds were also planted
on each sections of mini – plots, mini-plot O
served as the control. The setup was then
watered twice daily with water until the
tomatoes fully germinated within 9 days.
The Mathematical Model
The mathematical modeling will be
formulated using polynomial regression
based on the data collected from the results
using the method in Ref [14]. All data will be
solved and analyzed using MATLAB.
The Model
A polynomial function of a scalar
variable is an expression of the form
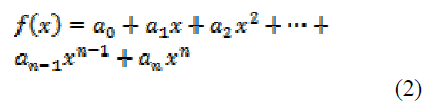
for some coefficients  .If
.If  , then the polynomial is said to be of
order n. A first-order polynomial equation is
the equation of a straight line and a secondorder
polynomial equation also describes a
parabola. Polynomials are just about the
simplest mathematical functions that exist,
requiring only multiplications and additions
for their evaluation. Two polynomials are
equal if they have the same coefficients of
like powers of the variable.
, then the polynomial is said to be of
order n. A first-order polynomial equation is
the equation of a straight line and a secondorder
polynomial equation also describes a
parabola. Polynomials are just about the
simplest mathematical functions that exist,
requiring only multiplications and additions
for their evaluation. Two polynomials are
equal if they have the same coefficients of
like powers of the variable.
A value  is called the root of the polynomial function
(2). Methods of getting the roots of a
polynomial equation has been studied
extensively in [21].
is called the root of the polynomial function
(2). Methods of getting the roots of a
polynomial equation has been studied
extensively in [21].
Polynomials are mostly used in
modeling a nonlinear relationship between a
response variable and an explanatory
variable. Polynomials are “useful for
interpolation, but notoriously poor at
extrapolation”.[20] . In this paper, we intend to
use this model to interpolate the data points
within [0,7] as can be seen in Figure 1.
High order polynomial are seldom
use in modeling because of parsimony and
interpretability of the model but our
interest in this research is to fit a polynomial that closely follows the pattern of the data
and also provide accurate results and so
higher order polynomials will be permitted
if it provides a better fit to the data under
study. The more complex a curve is, the
more polynomials are needed to fully
describe it. A polynomial of at most degree n
is uniquely needed to fit n+1 distinct
data points. . Because there are the same
number of coefficients in the polynomial as
there are data points [22]. This procedure of
getting such a polynomial is justified by the
use of the Lagrangian form of Higher
polynomial in this result which is stated here
without proof.
Theorem [22]
If  are n+1 distinct
points and
are n+1 distinct
points and  are
corresponding observations at these points,
then there exists a unique polynomial f(x),
of at most degree n, with the property that
are
corresponding observations at these points,
then there exists a unique polynomial f(x),
of at most degree n, with the property that
 for each
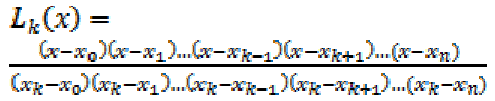
This polynomial is given by
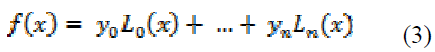
Where
The polynomial (3) passes through
each of the data points; the resultant sum of
the absolute deviations is zero.
Polynomial Regression Model
The kth order Polynomial regression
model in one variable can be expressed as
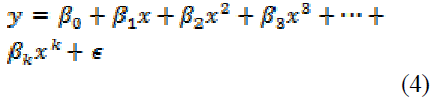
Where K is the degree of the
polynomial. This is a special case of a
multiple regression with one independent
variable. For example,
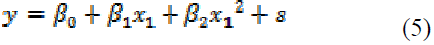
is a quadratic polynomial model that
provides a means of testing whether the
relationship between y and x1 is nonlinear(
although the model itself is linear in the
coefficients). A useful test for nonlinearities
is provided by a standard t test of the null
hypothesis that 
The mean squared error (MSE) is an
unbiased estimator of the variance σ2of the
random error term and is defined as
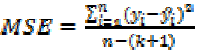 (6)
(6)
Where yi are observed values, are
the fitted values of the dependent variable
for the
are
the fitted values of the dependent variable
for the  case and
 is the
degree of freedom. The mean squared error
is the average squared error, therefore the
averaging is done by dividing by the degrees, MSE is a “measure of
how well the regression fits the data” . [24]
The root mean square error is given by the
square root of the mean square error.
is the
degree of freedom. The mean squared error
is the average squared error, therefore the
averaging is done by dividing by the degrees, MSE is a “measure of
how well the regression fits the data” . [24]
The root mean square error is given by the
square root of the mean square error.

The coefficient of determination (Rsquared, R2)
of the regression equation is
defined as
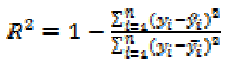 (7)
(7)
Where  is the arithmetic mean of
the y variable. R2 is the proportion of the
total variation in y explained by the
regression of y on x. R2 ranges in value
between 0 and 1. An R2 of 0 occurs when
the regression model does nothing to help
explain the variation in y. An R2 of 1 may
occur when all sample points lie on the
estimated regression line. When R2 value is
0.5 or below the regression explains only
50% or less of the variation in the data,
therefore prediction may be poor. [23,24]
is the arithmetic mean of
the y variable. R2 is the proportion of the
total variation in y explained by the
regression of y on x. R2 ranges in value
between 0 and 1. An R2 of 0 occurs when
the regression model does nothing to help
explain the variation in y. An R2 of 1 may
occur when all sample points lie on the
estimated regression line. When R2 value is
0.5 or below the regression explains only
50% or less of the variation in the data,
therefore prediction may be poor. [23,24]
Following from (1.6) the adjusted Rsquared
is defined as
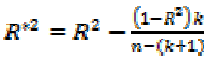 (8)
(8)
The adjusted R- squared is always
smaller as the R- squared.
Results and Discussion
Topsoil samples transferred from
Teak plantation was used to explore similar
effects and use that already exist in the leaf,
bark and root extracts on germination and
growth.
The addition of the samples of
topsoil from the L. tectona grandis
plantation affected the germination rate of
the tomato seeds and this, from the results,
mainly depended on the quantity(mass) of
topsoil used for the treatment [14]. As can be
seen from Table 1, as the quantity (mass) of
topsoil samples increased, the percentage
rate of germination of the tomato seeds
decreased and therefore the allelopathic
effect was strongest at the heaviest mass.
The aim of this study was to model the
allelochemical effect of the top soil sample
from the Teak plant on the seed germination
of lycopersicum esculentum. Since the simple scatter plot of the data from figure 1 gives a curvilinear relationship and our aim
is to interpolate the data, polynomial model
of the data will be appropriate in this
direction. All analyses in the modeling
process were done using a computer
software, MATLAB and with its Curve
Fitting Toolbox.
Table 1. Mean number of tomato seeds germinated and the germination percentage for
various of treatments of topsoil extracts from teak plantation
We fit a quadratic, cubic, quartic and
a polynomial of degree 5, and see which of
these models will provide a good
approximation of the relationship as can
seen in Figure 4
The basic statistical outputs are
shown in Table 2. The quartic polynomial
regression model is the best.The parameter
estimates for this model are
Table 2. Polynomial regression results
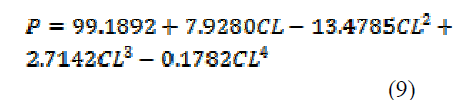
Where CL is the concentration levels
of the allelochemical.
The cubic spline method was used to
smooth the model as seen in Figure 2 and Figure 3. The smoothed quartic polynomial
model is in a good agreement with a wide
range of experimental data taken from the
literature that has been modelled in Ref [18]
suggesting that surface soil extract of
L.tectona grandis inhibits or stimulates
biological response in the germination of
lycopersicum esculentum.
Figure 2: Comparison of polynomial model with measured data
Figure 3: Fitted polynomial model with cubic spline smooth curve
Figure 4. Comparison of polynomial models with measured data
Conclusion
This study has demonstrated that the
allelopathic effects present in transferred
topsoil sampless of L. Tectona grandis on
the germination of lycopersicum esculentum
can be modeled using the quartic polynomial
model for any concentration of topsoil
between 0kg and 7 kg. This directly affects
the seed germination and seedling growth of
lycopersicum esculentum.
Acknowledgement
The authors are very grateful to the
reviewers for carefully reading the paper and
for their comments and suggestions which
helped to improve the paper.
References
- Rice, E.L.(1984). Allelopathy. 2nd edition. New York: Academic Press Inc.
- Reigosa, M.J., Pedrol, N., & Gonzalez, L.(eds) (2006). Allelopathy: A Physiological process with ecological implications. Dordrecht: Springer
- Konlay, A.K.(2007). Soil genesis, classification survey and evaluation. Volume 1. New Delhi: Atlantic Publishers and Distributors(P) Ltd.
- Singh, S.B., Nath, S., Pal, D.K. & Banerjee, S.K.(1985). Changes in soil properties under different plantation of the Darjeeling Forest Division. Indian Forester III: 90 - 98.
- Troeh, F. K. and Thompson, L.M. (2005). Soils and Soil Fertility, Sixth Edition, Iowa: Blackwell Publishing.
- Krishna, A., Manjunath, G.O., Ramesh,R., Siddappa, K., Rathod R. & Kannur, K. (2003). Allelopathic effect of four agroforestry tree species leaf leachates on seed germination of certain vegetable crops. J. Agric. Sci. 16: 430–433.
- Macias, F.A., Lacret,R., Varela, R.M., & Nogueiras, C. (2000). Allelopathic potential of Teak (Tectona grandis). In: Allelopathy-From Understanding to Application. Proc. 2nd Eur. Allel. Symp. Pp. 140.
- Sahoo, U.K., Upadhyaya, K., & Meitei, C.D.(2007). Allelopathic effects of Leucaena leucocephala and Tectona grandis on germination and growth of maize. Allel. J. 20(1): 135-143.
- Sree, D.S., Sankar, N.R., & Sreevamulu. (2008). Evaluation of thirteen medicinal plant extracts against teak (Tectona grandis) leaf. Biomedicine 3(1):33 - 35.
- Sahayaraj, K.(ed) (2014). Basic and applied aspects of biopesticides. New Delhi: Springer.
- Rizvi, S.J.H., & Rizvi, V.(eds) (1992). Allelopathy. Basic and applied aspects. London: Chapman & Hall.
- Kruse, M., Strandberg, M., & Strandberg, B. (2000). Ecological Effects of Allelopathic Plants–A Review. National Environmental Research Institute -NERI Technical Report No. 315. Silkeborg, Denmark
- Bhowmik, P.C., & Inderjit, H. (2003). Challenges and opportunities in implementing allelopathy. Crop prot. 22: 661-671.
- E. E. Mensah, I. Owusu – Mensah, E. Oppong and M. Osei-Saka(2015), Allelopathic Effect of Topsoil Extract From Tectona grandis L. Plantation on the Germination of Lycopersicum esculentum, Journal of Biology, Agriculture and Healthcare, Vol.5, No.2, 2015
- Min An (2005), The use of mathematical modelling in allelopathy, https://www.regional.org.au/au/allelopath y/2005/1/3/2625_anm1.htm?print=1,Retrived 3/11/2015
- Weidenhamer JD, Hartnett DC and Romeo JT (1989). Density-dependent phytotoxicity: distinguishing resource competition and allelopathic interference in plants. Journal of Applied Ecology 26, 613-624.
- Goslee SC, Peters DPC and Beck KG (2001). Modeling invasive weeds in grasslands: the role of allelopathy in Acroptilon repens invasion. Ecological Modelling 139, 31-45.
- An M, Johnson I and Lovett J (1993). Mathematical modelling of allelopathy: biological response to allelochemicals and its interpretation. Journal of Chemical Ecology 19, 2379-2388.
- An M, Johnson I and Lovett J (1996). Mathematical modelling of allelopathy: Phytotoxicity of plant residues during decomposition. Allelopathy Journal 3,33-42.
- Gordon K. Smyth(1998), Polynomial Approximation, Encyclopedia of Biostatistics (ISBN 0471 975761) John Wiley & Sons, Ltd, Chichester. https://www.statsci.org/smyth/pubs/EoB/ bap064-.pdf. Retrieved 3/10/2015
- Andrei D. Polyanin and Alexander V. Manzhirov(2007) Handbook Of Mathematics For Engineers And Scientists Taylor & Francis Group, LLC Chapman & Hall/CRC
- Giordano Frank R, Weir Maurice D, and Fox P. William(2003), A first Course in Mathematical Modeling, 3rd Ed. Brooks/Cole Thomson Learning, USA
- Robert S. Pindyck & Daniel L. Rubinfield(1991), Econometric Models and Economic Forecasts, 3rd Ed. McGraw Hill Inc.
- Eva Ostertagova(2012), Modelling using Polynomial regression, Procedia Engineering 48, 500 – 506.
- An M, Johnson I and Lovett J (2002). Mathematical modelling of allelopathy: the effects of intrinsic and extrinsic factors on residue phytotoxicity. Plant and Soil 246, 11-22.
- Belz R, Duke SO and Hurle K (2005). Dose-response: a challenge for allelopathy? onelinearity in Biol, Toxicol Med 39(2) pp 173 - 211. doi: 10.2201/nonlin.003.02.002.