Keywords
Depth of scour, circular jet, dimensional analysis, culvert.
Introduction
Study on scour of bed is of considerable importance in the field of hydraulic engineering.[1] Most often the flow
downstream of hydraulic structures is of the form of turbulent water jet, such as the flow from spillway, downstream
of gates, at the outlet of culverts and over the drops. Due to the complex nature of these flows and their interaction
with sediment bed, study on scour due to water jet has been mainly empirical.
Different investigators have reported extensive studies on the outlet scour. [1,2,3,4,5,6] have investigated the
scour due to vertically impinging circular jets. Studies on scour due to horizontal circular wall jet were carried out
by: [7…13]. Scour due to obliquely impinging jet was studied by [14…19].
This paper presents the results of an experimental study on the scour of sand bed particles by impinging circular
turbulent water jet. [11] Maximum depth of scour was correlated with stability number, drop height and outflow jet
diameter.
Dimensional Analysis
Figure 1 shows the schematic view of scour due to impinging circular jet [6]. Maximum depth of scour ds is
influenced by: velocity of outflow jet V, drop height Hc, outflow jet diameter D, mean sediment size d50,
acceleration due to gravity g, density of sediment ρs and density of water ρ. Therefore:
Figure 1. Schematic view of scour due to impinging circular jet
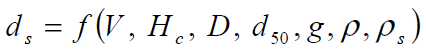 (1)
(1)
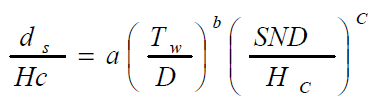
Using the method of dimensional analysis, Eq. (1) can be written as:
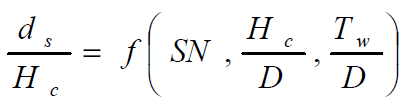 (2)
(2)
in which SN is densimetric Froude number given by:
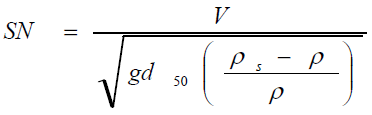 (3)
(3)
By combining the first two terms in the right hand side of Eq. (3) one can write:
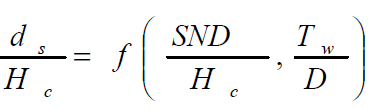 (4)
(4)
The correlation between parameters of Eq. (4) can be obtained by using the experimental data.
Materials and Methods
Experiments were conducted in a tilting re-circulating type flume with a length of 13m, width of 0.6m and depth of
0.6m. A schematic view of the flume is shown in Fig. 2. Horizontal culverts, for establishing circular jet, were made
of PVC and installed at the distance of 6m from upstream end of flume.[18] Different flow conditions were applied
in order to have various values of outflow jet velocity. The drop height Hc was measured from centerline of culvert
to original bed level. The sand particles used for the bed had a mean diameter d50 of 1.4mm, density of 2.605 and
geometric standard deviation of sg = 1.3. Sediments were filled up to a thickness of 0.20m at the downstream of
culvert. A sluice gate at the end of flume was used to control the tail water depth.[3] Discharge was measured by
volumetric method. Depth of flow and bed profile was measured by a point gauge with an accuracy of ±0.1mm. The
duration of experimental runs was kept equal to 22hrs in which the change in scour hole was observed to be no more
detectable. Experiments were conducted for various values of drop height, outflow jet diameter, out flow jet velocity
and tail water depth. Table 1 shows the range of parameters studied.[7]
Figure 2. Schematic view of the flume
Results
Figures 3 to 5 shows the variations of relative scour depth ds/Hc and SN for different values of relative outflow jet
diameter Hc/D when relative tail water depth Tw/D = 0.5 to 10 respectively. It is evident that by increasing SN, the
value of ds/Hc increases. Moreover, by increasing the relative outflow jet diameter Hc/D, the relative scour depth
ds/Hc increases. The experimental data of [8] is also depicted in Figs. 3 to 6 and shows a similar trend and good
agreement with present data [1].
Figure 3. Variations of relative scour depth ds/Hc and SN for different values Hc/D when
Figure 4. Variations of relative scour depth ds/Hc and SN for different values Hc/D when 2<=Tw/D <5
Figure 5. Variations of relative scour depth ds/Hc and SN for different values Hc/D when 5<=Tw/D <10
In accordance with Eq. (4), the experimental data is shown as variations of relative scour depth ds/Hc with SND/Hc
for various values of relative tail water depth. It is clear that by increasing SND/Hc, the relative scour depth
increases and by decreasing relative tail water depth Tw/D, the relative scour depth ds/Hc increases. Analysis of
experimental data indicates that the relative scour depth ds/Hc can be expressed as:
 (5)
(5)
By using least square method it was found that:

With these values, Eq. (5) reads:
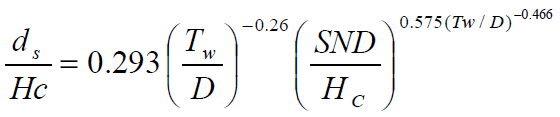 (6)
(6)
Figure 6. Variations of relative scour depth ds/Hc with SND/Hc for various values of relative tail water depth
The average percentage error due to Eq. (6) is 5.8 %. Figure 7 shows comparison of observed and computed values
of relative scour depth ds/Hc using Eq. (6). The present data and data of [8] are depicted in Figure (6). It is clear that
the majority of data points fall within error band of ±20%. Hence one can expect to have acceptable results using
Eq. (6). However, more data with wider range is required to verify the generality of this equation.
Figure 7. Comparison of observed and computed values of relative scour depth ds/Hc using Eq. (6).
Conclusion
Based on the results of this experimental study on the scour of sand bed particles by impinging circular turbulent jet,
the following conclusions could be derived:
The maximum depth of scour is a function of mainly the stability number SN and relative tail water depth Tw/Hc. By
increasing the stability number, the relative scour depth increases and by increasing the relative tail water depth, the
relative scour depth ds/Hc decreases.[17] A new equation for estimation of maximum depth of scour due to
impinging circular turbulent water jet is developed.
References
- S.R Abt, R.L Klberdanz, C Mendoza, J. Hydraulic Engineering, ASCE, 1984, 110(10), 1363-1367.
- B Westrich, H Kobus, Proceedings of IAHR congress, Istanbul, Turkey, 1973, Vol. 1, A13 1-8.
- N Rajaratnam, J. Hydraulic Engineering, ASCE, 1982, 108(2), 262-267.
- N Rajaratnam, B Berry, Journal, Hydraulic Research, IAHR, 1977, 15(3), 277-289.
- O Aderibigbe, N Rajaratnam, J. Hydraulic Research, IAHR, 1996, 34(1), 19-33.
- N Rajaratnam, K.A Mazurek, J. Hydraulic Research, IAHR, 2002, 40(6), 709-716.
- A.R Robinson, Transaction, ASAE, 1971, 14, 571-581.
- F Ade, N Rajaratnam, J. Hydraulic Research, IAHR, 1998, 36(4), 613-635.
- F Doehring, S.R Abt, J. Hydraulic Engineering, ASCE, 1994, 120(12), 1470-1476.
- M Ghodsian, A.A Abbasi, F.A Azar, 1998, Maximum depth of scour below free jet spillway, 5th seminar on river engineering, Ahvaz, Iran.
- F.W Blaisdell, C.L Anderson, J. Hydraulic Research, IAHR, 1988, 26(4), 357-376.
- Y.M Chiew, S.Y Lim. J. Hydraulic Engineering, ASCE, 1996, 122(9), 529-532.
- D Doddiah, M.L Albertson, R Thomson, Proceedings of the Minnesota International Hydraulic Convention, Minneapolis, Minnesota, USA, 1953, 161-169.
- M Ghodsian, A.A Abbasi, F.A Azar, 1999, Scour downstream of free over fall spillway, 28th congress of IAHR, Austria.
- S.Y Lim, C.O Chin, Advances in Hydro-science and Engineering, 1992, Vol. 1, 1989-1994.
- M Ghodsian, F.A Azar, 2001, International Symposium on Environmental Hydraulics, Arizona State University, USA.
- M Ghodsian, F.A Azar, 2002, International J. of Sediment Research.
- S.Y Lim, Institution of Civil Engineers, Water Maritime and Energy, 1995, 112, 136-149.
- C.S.P Ojha, J. Hydraulic Engineering, ASCE, 1999, 125(1), 83-85.


