Keywords
Beagle; T lymphocytes; Inflammatory bowel disease; Lymphocytic-plasmacytic enteritis; CD3; Canines.
Introduction
The intestinal immune system is constantly exposed to a vast array of luminal antigens, including those derived from food, components of the commensal microbial flora, and pathogenic organisms [1]. While protective immune response against intestinal pathogens is critical to avoid the invasion of the host, uncontrolled response against food antigens or commensal bacteria may lead to devastating inflammatory diseases. Thus, the intestinal immune homeostasis must be tightly regulated to avoid a state of chronic uncontrolled inflammation [2]. Current data in human patients suggest that inflammatory bowel disease (IBD) is the result of various predisposing genetic and environmental factors acting on the immunoregulatory system [3], eventually leading to its overactivation and excessive inflammation of the gastrointestinal mucosa. Furthermore, IBD is likely also the result of an imbalance between effector and regulatory T cell responses [4]. Canine IBD has been defined as a spectrum of gastrointestinal disorders with persistent or recurrent diarrhea and/or vomitus, failure to respond to parasiticides, antibiotics and gastrointestinal protectants, failure to document neoplasia or other causes of gastroenteritis by thorough diagnostic evaluation and histologic evidence of benign intestinal inflammation. This inflammation is further classified by the type of cellular infiltrate (neutrophilic, eosinophilic, lymphocytic, plasmacytic and granulomatous), where lymphocytic-plasmacytic infiltration is the most common form in dogs [5]. Increased numbers of CD3+ lymphocytes in lamina propria (LP) and lamina epithelialis (LE) have been documented in lymphocytic colitis [6-9] in the duodenum of dogs with IBD [9,10], and in histiocytic ulcerative colitis [11]. In contrast to these studies, a reduced number of CD3+ cells were found in the small intestine of dogs with IBD [12]. Furthermore, decreased lymphocyte apoptosis has been documented in the duodenum of dogs with IBD [13]. Given the important role of T lymphocytes in IBD and the somewhat conflicting results, further studies on absolute numbers, distribution pattern and subpopulations of intestinal T cells are needed for clarification. Therefore, the aim of this study was to appoint a method to determine the distribution of CD3+ lymphocytes from stomach to colon and from LP and LE in healthy dogs of a single breed to allow subsequent comparison with dogs of other breeds and dogs suffering from chronic enteropathies like IBD and food responsive diarrhea (FRD) or other diseases changing the immune response in the bowel. The additional comparison of intestinal CD3+ cells in adult versus neonatal dogs determines if this distribution pattern is present since birth.
Materials and Methods
Dogs
Full thickness biopsies of clinically healthy Beagles were obtained at necropsy immediately after euthanasia. Ten adult clinically healthy dogs from a research facility were eliminated for reasons unrelated to the gastrointestinal tract, whereas four neonatal puppies (1-2 days old) were super-numerous at a laboratory animal breeding facility. The group of adult dogs had a median age of 11 years (range 9-11 years).
All experimental procedures were approved by the Cantonal Committee for Animal Experimentation, Bern, Switzerland. Immediately after euthanasia by intravenous barbiturate injection, full thickness sections from seven different localizations were obtained: stomach (pyloric region), descending and ascending duodenum (at the end of the right pancreatic limb and at the transition to the jejunum), jejunum (middle part), ileum (close to the ileocaecal junction), and ascending and descending colon (next to the caecocolic junction and at the transition to the rectum; Figure 1). From all localizations and all dogs, routine staining with hematoxylin and eosin were performed and examined by a single boardcertified pathologist.
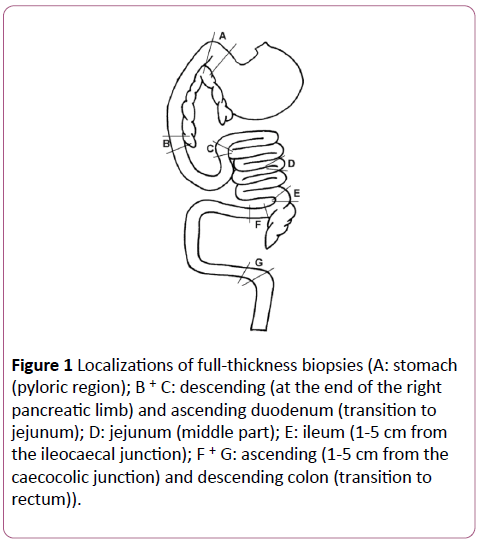
Figure 1: Localizations of full-thickness biopsies (A: stomach (pyloric region); B + C: descending (at the end of the right pancreatic limb) and ascending duodenum (transition to jejunum); D: jejunum (middle part); E: ileum (1-5 cm from the ileocaecal junction); F + G: ascending (1-5 cm from the caecocolic junction) and descending colon (transition to rectum)).
Antibodies
Preliminary work revealed that the mouse anti-canine CD3 (Clone CA17.2A12, Serotec, Oxford, GB) is not suitable for staining paraffin-embedded tissue (results not shown). In contrast, a rabbit anti-human CD3 antibody (NeoMarkers, Fremont, USA) has been shown to work on paraffin-embedded tissue and to cross-react with canine T cells (unpublished work from manufacturer). To prove specificity of the rabbit antihuman CD3 for canine CD3, antibodies were tested on cytospins of highly purified canine peripheral blood CD4+ T cells. Briefly, mononuclear cells were isolated from peripheral blood of a healthy dog using a Ficoll paque plus density gradient (GE Healthcare, Uppsala, Sweden) as described by the manufacturer. Mononuclear cells were then stained with rat anti-canine CD4 RPE Ab (Clone YKIX 302.9, Serotec) and sorted for CD4+ T cells on a FACSVantage cell sorter (BD Biosciences, Franklin Lakes, NJ, USA). After cytospin (3 minutes, 300g), the CD4+ cells were either stained with rabbit Immunoglobin G (Sigma, St. Louis, USA) as isotype control, mouse anti-canine CD3, or rabbit anti-human CD3, followed by the adequate biotinylated secondary Abs (goat anti-mouse or goat antirabbit, Dako, Glostrup, Denmark). The CD4+ T lymphocytes were positively stained with both Abs, whereas the isotype control was negative (Figures 2a-2c). Another control with the rabbit anti-human CD3 was performed by immunohistochemistry. The Ab stained canine cells in wellknown localizations of CD3+ cells, as around the vessels in the spleen (periarteriolar lymphoid sheaths; PALS) and in the lymph follicles in the ileum of neonatal puppies (Figures 2d-2f).
Figure 2:Test of specificity of anti-CD3 staining on isolated T cells and tissue sections (a, b, c: Lymphocytes were isolated from peripheral blood from a healthy dog and sorted for CD4+ cells. Cytospin preparations were stained with an isotype control (rabbit IgG); (bar 20 μm; x 100 oil) (a), mouse anti-canine CD3 (b), and rabbit anti-human CD3 (c). d, e, f: Examples of anti-CD3 immunohistochemistry from healthy dogs with isotype control (rabbit IgG; spleen) (bar 50 µm; x 40) (d) and rabbit anti-human CD3 in the spleen (e) and the ileum (f)).
Tissue preparation and immunohistochemistry
After obtaining the tissue, it was transported in gauze tinctured with 0.9% sodium chloride solution in plastic tubes in a cooled box. Tissue samples were then fixed in 4% paraformaldehyde and embedded in paraffin. The sections were cut in 5 μm slices and used for immuno-histochemical examination. The tissue sections were deparaffinized, rehydrated and boiled for 10 min in a steamer. After rinsing in Tris-buffered saline (TBS, pH 7.4), the endogenous peroxidase activity was blocked by incubation with endogenous peroxidase blocking solution (S2001, Dako) for 20 minutes in a moist chamber at 20°C. After a washing step with TBS, the sections were incubated with 5% goat serum supplemented with 0.5% casein and 0.1% sodium azide in TBS (Ab dilution buffer) for 30 minutes at 20°C. The tissue was then stained with the primary Ab (rabbit anti-human CD3, diluted 1:200 in Ab dilution buffer with 5% goat serum [adult dogs] or with 2.5% goat serum and 2.5% dog serum [neonatal dogs]) for 60 min in a moist chamber at 20°C. The dog serum was added to the Ab dilution buffer for the neonates to avoid background staining of the phagocyted maternal Abs in the LE due to the polyclonal character of the rabbit anti-human CD3 Ab. Purified rabbit immunoglobulin was used at 1 μg/ml as staining control. Sections were then washed for 2 × 3 min in TBS.
The secondary biotinylated goat anti-rabbit Ab (1:200) were applied for 60 min in a moist chamber at 20°C. Sections were washed 2 × 3 min in TBS prior to incubation with the preaggregated avidin-biotinylated horseradish peroxidase complex (K 0376, Dako) (1:200 in TBS) for 40 minutes. After washing in TBS, immunohistochemistry was developed by incubating sections for 7-8 min in the dark with horseradish peroxidase substrate solution (0.2 mg/ml 3,3´- diaminobenzidine tetrahydrochloride DAB, 0.012% H2O2, 20 mM citric acid monohydrate, 100 mM imidazole, 100 mM NaCl, pH 7.0) in a glass cuvette. Slides were washed and counterstained for 30 seconds with hematoxilin, followed by rinsing in tab water. Sections were then dehydrated (2 × 20 s 35% ethanol, 2 × 20 s 70% ethanol, 2 × 20 s 95% ethanol, 2 × 2 min 100% ethanol, 2 × 5 min xylol) and mounted with Eukitt mounting medium (Electron Microscopy Sciences, Hatfield, GB) and appropriate cover slips [13].
Evaluation of sections
All sections were analyzed by a single investigator (NSP). Initial analysis of the distribution of positive cells was made with the x5, x10 and x20 objectives. Images were taken with a microscope (Axioplan 2, Zeiss, Feldbach, Switzerland) and a digital camera (Axiocam HR, Zeiss) with the x20 objective and were transferred to a computer. Cell counts were obtained with a computer image analysis system (Pro Plus, Version 1.3.1., MediaCybernetics, Maryland, USA).
The CD3+ lymphocytes were counted in the villus and crypt region in the small bowel, whereas in the stomach and large bowel, they were counted in top and base area of the tunica mucosa (Figure 3). The space between the crypts and the lamina muscularis mucosae was not taken into evaluation. In each area, the LE and the LP were delineated on the computer screen and the positively stained cells were identified by the investigator in an area of minimally 200,000 μm2 per area. The results were expressed as positive cells per 200,000 μm2 in top and base of LE and LP, respectively for each localization.
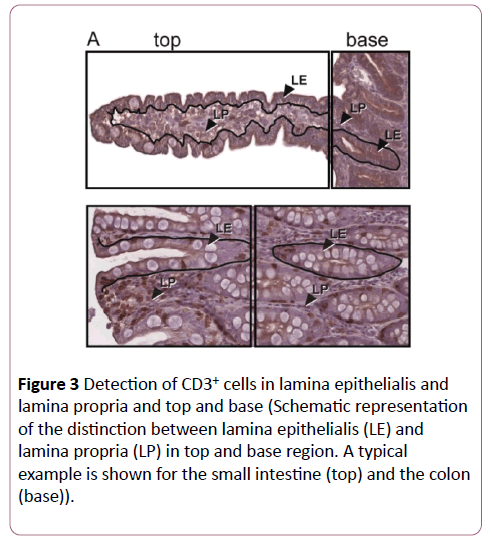
Figure 3: Detection of CD3+ cells in lamina epithelialis and lamina propria and top and base (Schematic representation of the distinction between lamina epithelialis (LE) and lamina propria (LP) in top and base region. A typical example is shown for the small intestine (top) and the colon (base)).
Statistical Analysis
In order to find differences between the seven localizations repeated measures ANOVAs with Bonferroni correction for multiple comparisons were performed for the four different sites in the adults and the neonates with the software package SPSS (SPSS® version 14.0 SPSS Inc., Chicago, IL, USA). For the comparison of LE versus LP and top versus base a Wilcoxon signed rank test was performed.
Results
Histology
Hematoxylin and eosin stained sections were initially examined by a single board-certified pathologist. Four adult dogs did not comply with the requirements of the study (autolysis, missing samples) and were therefore excluded. The majority of sections had normal architecture and cellular distribution, but abnormalities were occasionally observed. In all cases, these changes were focal and minimal. Thus, cell counts were not made in the abnormal areas [14].
Adult dogs
Horizontal distribution: An example of the different localizations of an adult dog is presented in Figure 4.
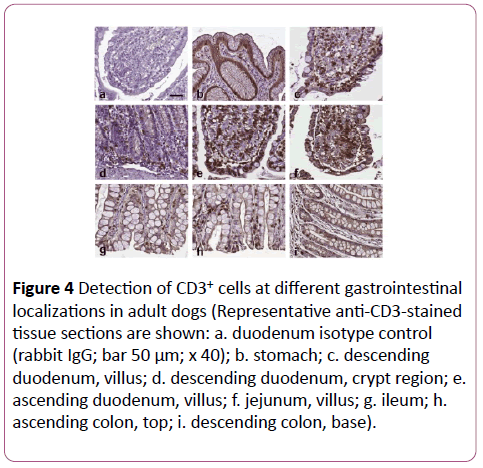
Figure 4: Detection of CD3+ cells at different gastrointestinal localizations in adult dogs (Representative anti-CD3-stained tissue sections are shown: a. duodenum isotype control (rabbit IgG; bar 50 μm; x 40); b. stomach; c. descending duodenum, villus; d. descending duodenum, crypt region; e. ascending duodenum, villus; f. jejunum, villus; g. ileum; h.ascending colon, top; i. descending colon, base).
The stomach contained almost no CD3+ cells. From the small intestine to the colon a decline in CD3+ cells in top LE and LP was seen (Figure 5). The ileum showed in top LP similar numbers of CD3+ cells than the rest of the small intestine, whereas in top LE of the ileum, the numbers were similar to those of the colon.
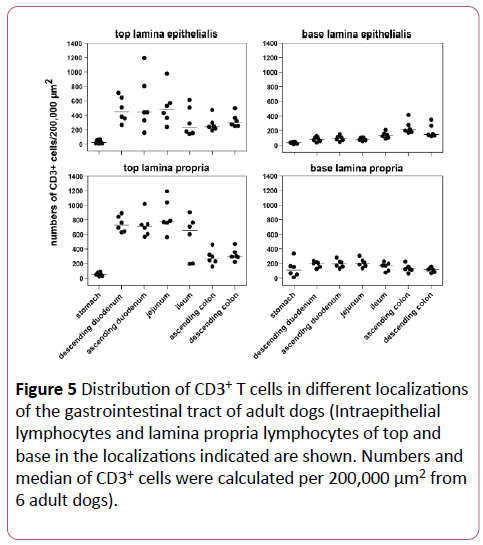
Figure 5: Distribution of CD3+ T cells in different localizations of the gastrointestinal tract of adult dogs (Intraepithelial lymphocytes and lamina propria lymphocytes of top and base in the localizations indicated are shown. Numbers and median of CD3+ cells were calculated per 200,000 μm2 from 6 adult dogs).
The obvious differences between small and large intestine from the top where not evident anymore in the base LE and LP. The significant differences of the horizontal distribution are shown in Table 1.
| Variables |
p - value |
| Top LE |
S |
DD |
0.024 |
| S |
AC |
0.034 |
| S |
DC |
0.008 |
| Top LP |
S |
DD |
0.001 |
| S |
AD |
0.004 |
| S |
J |
0.009 |
| S |
DC |
0.027 |
| DD |
AC |
0.004 |
| DD |
DC |
0.003 |
| AD |
AC |
0.020 |
| J |
AC |
0.033 |
| Base LE |
S |
I |
0.045 |
| S |
AC |
0.039 |
| AD |
AC |
0.045 |
| Base LP |
No Significant Differences |
Abbreviations: S: Stomach; DD: Descending Duodenum; AD: Ascending Duodenum; J: Jenunum; I: Ileum; AC: Ascending Colon; DC: Descending Colon
Table 1: Horizontal distribution of CD3+ lymphocytes in adult dogs.
Vertical distribution: The vertical distribution revealed a decrease from the top of the villi to the base for the small intestine, whereas there was no obvious difference between top and base in the colon. In the tips of the villi, there was an obvious compartmentalization of T lymphocytes, with a gradual decline towards the base of the villi and the crypts.
When comparing the four layers together, the variation of CD3+ cells was higher in top LE compared to top LP, whereas it was minimal in the basal layers (Figure 5). The vertical distribution is summarized in Table 2.
| Variables |
S |
DD |
AD |
J |
I |
AC |
DC |
| Top LE - Base LE |
0.753 |
0.028* |
0.028* |
0.028* |
0.046* |
0.173 |
0.028* |
| Top LP - Base LP |
0.345 |
0.028* |
0.028* |
0.028* |
0.028* |
0.028* |
0.028* |
| Top LE- Top LP |
0.249 |
0.046* |
0.173 |
0.028* |
0.028* |
0.753 |
0.917 |
| Base LE -Base LP |
0.046* |
0.028* |
0.028* |
0.028* |
0.249 |
0.028* |
0.028* |
Significant differences (p<0.05) are marked with *.
S: Stomach; DD: Descending Duodenum; AD: Ascending Duodenum; J: Jenunum; I: Ileum; AC: Ascending Colon; DC: Descending Colon.
Table 2: Vertical distribution of CD3+ lymphocytes in adult dogs.
Neonatal dogs
Horizontal distribution: An example of the different localizations of a neonatal dog is presented in Figure 6. The stomach contained almost no CD3+ cells. From the small intestine to the colon a decline in CD3+ cells in top LE and LP was seen (Figure 7). In the top LE, the ileum showed less CD3+ cells than the colon. Unlike in adult dogs, the jejunum revealed less positive cells in top LE and LP than the duodenum, whereas the ascending colon had a similar density of CD3+ cells as the jejunum. The obvious differences between duodenum and the rest disappeared in the base LE and LP. With regard to significant differences, the jejunum expressed less CD3+ cells in top LE than the descending duodenum (p=0.007). In top LP, the stomach revealed significantly less CD3+ lymphocytes than the ileum (p=0.044), whereas there were no significant differences detectable in the basal layers.
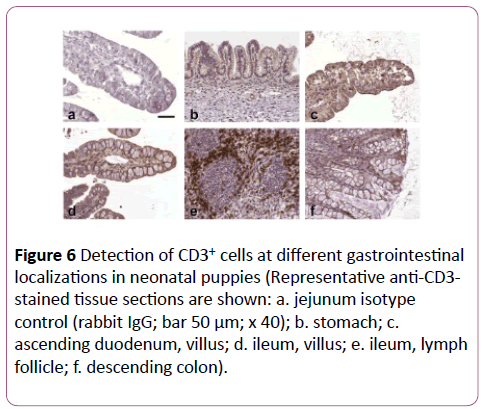
Figure 6: Detection of CD3+ cells at different gastrointestinal localizations in neonatal puppies (Representative anti-CD3-stained tissue sections are shown: a. jejunum isotype control (rabbit IgG; bar 50 μm; x 40); b. stomach; c.ascending duodenum, villus; d. ileum, villus; e. ileum, lymph follicle; f. descending colon).
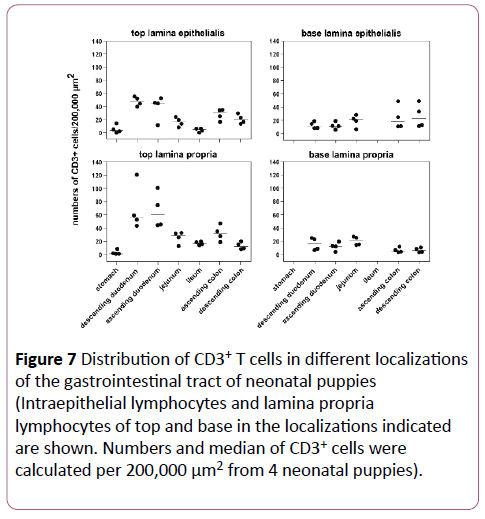
Figure 7: Distribution of CD3+ T cells in different localizations of the gastrointestinal tract of neonatal puppies (Intraepithelial lymphocytes and lamina propria lymphocytes of top and base in the localizations indicated are shown. Numbers and median of CD3+ cells were calculated per 200,000 μm2 from 4 neonatal puppies).
Vertical distribution: The vertical distribution revealed a decrease from the top to the base of the duodenum, whereas there was no obvious difference between top and base in the jejunum (Figure 7). In the ileum, a comparison between top and base was not possible due to the fact that the base region contained numerous lymph follicles (Figure 6e). In the ascending colon, a decline from top to base was seen, whereas there was no obvious difference in the descending colon. Statistically no significant differences were found.
Comparison between adult and neonatal dogs
Compared to the adult dogs, the neonatal dogs showed a similar distribution pattern, but on average ten times less CD3+ lymphocytes in the analogous localizations (Figures 5 and 7). Nevertheless, differences were found in top LE and LP in the jejunum, ileum and ascending colon: the jejunum in neonates yielded less CD3+ cells than the duodenum, the ileum showed less CD3+ cells than the ascending colon, and the ascending colon expressed more positive cells than the descending colon. Furthermore, the amount of CD3+ cells in top LE and LP of the small intestine was similar in neonatal dogs, whereas in adult dogs, there were significantly more positive cells in the LP. In the basal layers, there were two major differences between neonatal and adult dogs. In the stomach of neonatal dogs, the difference between top and base could not be determined because there was no obvious base region (Figure 6b). The second major difference was found in the ileum, where the base region was full of lymphoid follicles with a B cell nucleus and CD3+ lymphocytes around it (Figure 6e), which made comparative counting impossible.
Discussion
IBD is a common cause of chronic diarrhea in dogs, where lymphocytic-plasmacytic infiltration in the LP is the most common histological finding. The histological interpretation of LP cellularity relies on the experience of the pathologist, even though attempts for standardization of histology have been made [15]. The main goal of this study was to establish a bench mark for CD3+ lymphocyte distribution in healthy dogs for further analysis and comparison with dogs suffering from IBD and FRD. Therefore, the investigators wanted to establish a cell counting system where the values of CD3+ lymphocytes in LP (LP lymphocytes=LPL) and LE (intraepithelial lymphocytes=IEL) are determined the same way and the two compartments can be compared.
In previous studies, CD3+ lymphocytes in the LE were specified by numbers of IEL per 100 enterocytes [7,14,16,17]. In contrast, counting the CD3+ cells per area using an image analyzing software program or a grid may prove to be easier to use in diagnostical analysis. Furthermore, by counting the cells in defined total areas (i.e., 200,000 μm2), the results should be less susceptible to a sampling bias. To count CD3+ cells in at least 200,000 μm2 in adult dogs two to five images of a specific region (with a 20-x objective) and eight to ten images in neonatal dogs had to be analyzed. This chosen area is 3.5 to 20 times bigger than those examined in previous studies with the idea to get more accurate and stable results for the LPL as well as the IEL. In previous studies, the LPL were specified as positive cells per 100 mononuclear cells in an area of 60,500 μm2 [4], per area of 10,000 μm2 [14,17] or 5-10 × 2500 μm2 [16]. Due to the different counting methods used in these studies, CD3+ IEL and LPL could not be compared together.
All but one of these former studies [17] used a rabbit antihuman CD3 Ab from Dako, cross-reacting with canine CD3. In our study, a different rabbit anti-human CD3 Ab from NeoMarkers was used. Therefore, the specificity of this antibody for canine CD3 had to be proven. This was demonstrated by sorting canine CD4+ T cells from peripheral blood and simultaneously staining them with an anti-canine CD3 Ab (not suitable for paraffin sections) and the rabbit antihuman CD3 Ab (suitable for paraffin sections). Both antibodies specifically stained CD4+ T cells (Figures 2b and 2c). Furthermore, the rabbit-anti human CD3 Ab stained canine cells in well-known localizations of CD3+ cells, as around the vessels in the spleen (PALS) and in the lymph follicles in the ileum of a neonatal puppy (Figures 2e and 2f).
In the study presented herein, a higher number of localizations over the whole gastrointestinal tract were taken into account than in former studies, with 7 localizations from the stomach to the colon. Thus, more detailed differences from every single part of the intestine are available. The stomach yielded almost no CD3+ cells. This finding is expected because of the minimal bacterial flora due to the acidic gastric juice and the surface protection by mucus [18]. The highest number of CD3+ lymphocytes is seen in the small intestine. The decline of the number of T cells from the small intestine to the colon could be explained with the decreasing antigen load as a consequence of the degradation of ingesta [17]. The compartmentalization of CD3+ lymphocytes in the villi of the duodenum and the lower number in the crypts is, although different regions and localizations evaluated, also seen in other studies [14,16,17]. Jergens described a uniform distribution in 3 different localizations in the villi of the duodenum [10]. This compartmentalization of the CD3+ lymphocytes in the tip of the villi in the small intestine probably reflects an increasing level of exposure to luminal antigens [16]. Furthermore, T cell responses depend on presentation of antigens by molecules of the major histocompatibility complex (MHC) on antigen-presenting cells (APC). MHC class II+ APC are predominantly dentritic cells, which in dogs are located in subepithelial regions of the villus LP [16,17].
The absolute numbers of CD3+ cells observed in LP of adult dogs in this study were similar to those described in the study of German et al. When comparing the results for adult dogs with Elwood and co-workers, they found much more CD3+ LPL in the top and center of the villi (~4 times more in duodenum, jejunum and ileum), but similar numbers in the base of the villi and the crypts. Kleinschmidt et al. on the other hand had much lower numbers of CD3+ cells, which he explained with the use of a monoclonal anti-CD3 antibody compared to polyclonal antibodies used by Elwood and German. Nevertheless, given the much higher area accounted for in the study described herein, the authors expect their results to be more accurate and less susceptible to bias. As already described above, the absolute number of CD3+ IEL is not comparable to other studies due to a different counting method used. In the small intestine, the top LE yielded less CD3+ cells and a greater variation than the top LP in adult dogs, but not neonates. It has been suggested that T cells migrate from the LP towards the lumen in response to antigenic stimulation [12] and that LPL function as a reservoir for the IEL population. Therefore, it would be very interesting to compare healthy dogs in a heterogenous population and with dogs with IBD or FRD or other immune system triggered diseases, and before and after therapy.
The distribution pattern of CD3+ lymphocytes in neonates was similar to adults, but on average, ten times less CD3+ lymphocytes were found in the analogous localizations. The immune system of neonates is immunologically competent at the time of birth, but any immune response in infancy must necessarily be a primary response. According to Chappuis [19] the maturation of the immune response will occur during the first two to three weeks. With this in mind, a continuous augmentation of the number of T lymphocytes should take place in the first month of life. Kleinschmidt et al. examined the intestine of young dogs (1 month to 1 year) and compared it with adult and senior dogs. As discussed above, their results were not comparable with our results, partially due to the use of another anti-CD3 Ab. Nevertheless, the distribution in the LP of the villi and the base of the crypts was similar.
In a small group of nineteen dogs with chronic enteropathies, Schreiner et al. did not find significant differences in CD3+ cells in duodenal LP before and after therapy in 10,000 μm2 [20,21]. At the end of our study, the new protocol with 200,000 μm2 was used to investigate endoscopical biopsies from dogs with chronic enteropathies. Biopsies of duodenum and colon of three dogs with FRD, two dogs with IBD, and duodenum of three dogs with proteinlosing enteropathy (PLE) secondary to severe IBD were analyzed (Figure 8).
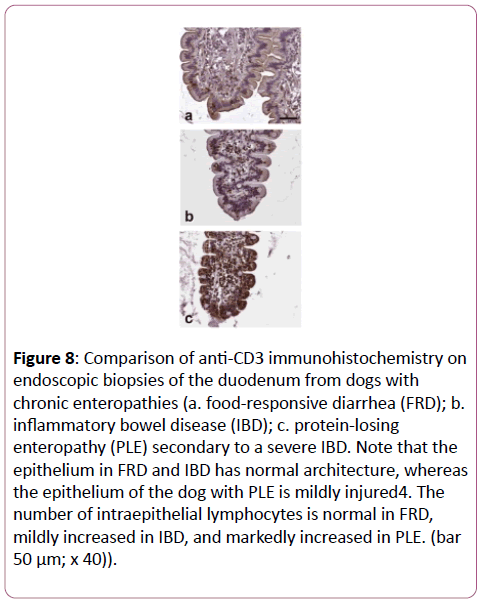
Figure 8: Comparison of anti-CD3 immunohistochemistry on endoscopic biopsies of the duodenum from dogs with chronic enteropathies (a. food-responsive diarrhea (FRD); b. inflammatory bowel disease (IBD); c. protein-losing enteropathy (PLE) secondary to a severe IBD. Note that the epithelium in FRD and IBD has normal architecture, whereas the epithelium of the dog with PLE is mildly injured4. The number of intraepithelial lymphocytes is normal in FRD, mildly increased in IBD, and markedly increased in PLE. (bar 50 μm; x 40)).
Histologically, the surface and architecture looked similar to that of the clinically healthy dogs. The decline of CD3+ T cells from the small intestine to the colon and from the villi to the crypts was similar as in healthy dogs. In the villi, a compartmentalization as described in healthy dogs could not be seen, and the CD3+ lymphocytes were more disseminated over the whole villus [22,23]. The biopsies of dogs with PLE revealed a lot more CD3+ lymphocytes in the villi than biopsies from healthy dogs or dogs with FRD or IBD. However, due to the limited number of samples, these results have to be considered preliminary and further studies with a higher number of diseased dogs are needed to obtain conclusive and statistically significant results.
Conclusion
In conclusion, the evaluation of the distribution of CD3+ lymphocytes in healthy adult dogs can be used as bench mark to be compared with the distribution in dogs with chronic enteropathies like IBD or FRD. Furthermore, the comparison with the neonatal puppies may help to understand the process of maturation of the immune system. Whether the tenfold increase of CD3+ lymphocytes is a continuous event or occurs in the first few weeks of life is currently not known.
Acknowledgements
The authors would like to thank Anna Oevermann and Andreas Kappeler for their support in histology and immunohistochemistry, Bernadette Wider for cell sorting, Daniel Sidler and Mario Noti for help with generation of graphs, as well as Novartis Santé Animal SA, St-Aubin, Switzerland, for the possibility to take the necessary biopsies.
Conflict of Interest
The authors declared no potential conflicts of interest with respect to the research, authorship, and/or publication of this article.
Funding
This work was supported by the Department of Clinical Veterinary Medicine of the Vet Suisse Faculty of the University of Bern and in part by a grant from Swiss National Science Foundation and Crohn’s and Colitis Foundation of America to TB.
References
- Bauer E, Williams BA, Smidt H, Verstegen MW, Mosenthin R (2006) Influence of the gastrointestinal microbiota on development of the immune system in young animals. Current Issues in Intestinal Microbiology (CIIM) 7: 35-51.
- German AJ, Hall E, Day MJ (2003) Chronic intestinal inflammation and intestinal disease in dogs. J Vet Intern Med 17: 8-20.
- Sartor RB (1997) Pathogenesis and immune mechanisms of chronic inflammatory bowel diseases. Am J Gastroenterol 92: 5-11.
- Strober W, Fuss IJ, Blumberg RS (2002) The Immunology of mucosal models of inflammation. Ann Rev Immunol 20: 495-549.
- Hall EJ, German AJ (2003) Diseases of the Small Intestine. In: Textbook of Veterinary Internal Medicine. Ettinger SJ, Feldmann EC (eds), Elsevier Saunders, St. Louis, USA, pp. 1332-1408.
- Leib MS, Hiler LA, Roth L, Thatche, C, Monroe WE, et al. (1998) Plasmacytic lymphocytic colitis in the dog. Seminars in Veterinary Medicine & Surgery (Small Animal) 4: 241-249.
- Stonehewer J, Simpson JW, Else RW, Macintyre N (1998) Evaluation of B and T lymphocytes and plasma cells in colonic mucosa from healthy dogs and from dogs with inflammatory bowel disease. Res Vet Sci 65: 59-63.
- Jergens AE, Gamet Y, Moore FM, Niyo Y, Tsao C, et al. (1999) Colonic lymphocyte and plasma cell populations in dogs with lymphocytic-plasmacytic colitis. Am J Vet Res 60: 515-520.
- German AJ, Hall EJ, Day MJ (2001) Immune cell populations within the duodenal mucosa of dogs with enteropathies. J Vet Int Med 15: 14-25.
- Jergens AE, Moore FM, Haynes JS, Miles KG (1992) Idiopathic inflammatory bowel disease in dogs and cats: 84 cases (1987-1990). J Am Vet Med Ass 15: 1603-1608.
- German AJ, Hall EJ, Kelly DF, Watson AD, Day MJ (2000) An immunohistochemical study of histiocytic ulcerative colitis in boxer dogs. J Comp Pathol 122: 163-175.
- Jergens AE, Moore FM, Kaiser MS, Haynes JS, Kinyon JM (1996) Morphometric evaluation of immunoglobulin A-containing and immunoglobulin G-containing cells and T cells in duodenal mucosa from healthy dogs and from dogs with inflammatory bowel disease or nonspecific gastroenteritis. Am J Vet Res 57: 697-704.
- Dandrieux JR, Bornand VF, Doherr MG, Kano R, Zurbriggen A, et al. (2008) Evaluation of lymphocyte apoptosis in dogs with inflammatory bowel disease. Am J Vet Res 69: 1279-1285.
- German AJ, Hall EJ, Day MJ (1999) Analysis of Leucocyte Subsets in the Canine Intestine. J Compar Pathol 120: 129-145.
- Day MJ, Bilzer T, Mansell J, Wilcock B, Hall EJ, et al. (2008) Histopathological standards for the diagnosis of gastrointestinal inflammation in endoscopic biopsy samples from the dog and cat: A report from the World Small Animal Veterinary Association Gastrointestinal Standardization Group. J Comp Pathol 138: 1-43.
- Elwood CM, Hamblin AS, Batt RM (1997) Quantitative and qualitative immunohistochemistry of T cell subsets and MHC class II expression in the canine small intestine. Vet Immunol Immunopathol 58: 195-207.
- Kleinschmidt S, Meneses F, Nolte I, Hewicker-Trautwein M (2007) Distribution of mast cell subtypes and immune cell populations in canine intestines: Evidence for age-related decline in T cells and macrophages and increase of IgA-positive plasma cells. Res Vet Sci 84: 41-48.
- Todar K (2008) In: Todar’s Online Textbook of Bacteriology. Available at: https://www.textbookofbacteriology.net/
- Chappuis G (1998) Neonatal immunity and immunisation in early age: Lessons from veterinary medicine. Vaccine 16, 1468-1472.
- Schreiner NM, Gaschen F, Gröne A, Sauter SN, Allenspach K (2008) Clinical signs, histology, and CD3-positive cells before and after treatment of dogs with chronic enteropathies. J Vet Int Med 22: 1079-1083.
- Guilford WG (1996) Idiopathic inflammmatory bowel diseases. In: Strombeck’s Small Animal Gastroenterology, Guilford WG, Center, SA, Strombeck DR, Williams DA, Meyer DJ, (eds), Saunders, Philadelphia, USA. pp. 451-485.
- Isaacs KL, Lewis JD, Sandborn WJ, Sands BE, Targan SR (2005) State of the art: IBD Therapy and clinical trials in IBD. Inflammatory Bowel Diseases 11: 3-12.
- Jakob S, Corazza N, Diamantis E, Kappeler A, Brunner T (2008) Detection of apoptosis in vivo using antibodies against caspase-induced neo-epitopes. Methods 44: 255-261.