Etoundi Omgba Cunégonde Blanche1*, Mbock Émilie Danielle1, Djopnang Djimbie Justin2, Moussambe Abanga Agathe3 and Ngom Ngom Trésor1
1Department of Biochemistry, University of Douala, Cameroon
2Department of Processing and Quality Control, Institute of Fisheries and Aquatic Sciences, Cameroon
3Department of Clinic Biology, University of Douala, Cameroon
*Corresponding Author:
Blanche EOC
Department of Biochemistry
University of Douala, Cameroon
Tel: +237 695 41 89 79
E-mail: blancheetoundi@hotmail.fr
Received Date: September 26, 2017; Accepted Date: September 28, 2017; Published Date: October 02, 2017
Citation: Blanche EOC, Danielle ME, Justin DD, Agathe MA, Trésor NN (2017) Glycaemic Index and Macronutrients Content of Three Traditional Cameroonian Meals. J Food Nutr Popul Health Vol.1 No.2:20
Keywords
Glycaemic index; Traditional meals; Macronutrients content
Introduction
Glycaemic Index (GI) is a functional measure widely used to assess carbohydrate quality. It’s a parameter used to classified carbohydrates containing food according to their ability to raised blood glucose [1]. GI measures the incremental blood glucose response to carbohydrates contained in a food, expressed as a percentage of the response to a reference food, usually glucose or white bread [1]. Recent studies have demonstrated that in contrary to the intake of low or moderate GI food, the intake of high GI food generates with time a high or chronic postprandial glycaemia, leading to metabolic pathologies [2,3]. In 2011, they have represented 80 percent of all the deaths throughout the world [4]. Cameroon is one of the countries in sub-Saharan Africa that is increasingly touched by these pathologies. In 2014 in this country, the World Health Organization (WHO) had registered about 239,000 deaths due to these diseases among which diabetes, obesity, and coronary cardiovascular diseases were representing 6, 10.3, and 11 percent respectively [5]. The increasing knowledge on the metabolic effect of traditional meals commonly consumed in our country will prevent more high prevalence on coming years [5]. For many traditional Cameroonians meals, the GI has not been defined yet. Therefore, the knowledge on the GI and nutritional composition of commonly consumed meal in Cameroon will help: -the experts in nutrition during diet schedule, -in the formulation of an adequate regimen for specific groups, -in food choice for those people in need to control their food intake. Our study aimed to determine the GI and macronutrients content (Mc) of three meals traditionally consumed in Cameroon. The studied sauces commonly called “Bongo Tchobi” (BT), “Kwem with groundnut” (KG) and “Flutted pumkin with pistachio” (FP), were mainly constituted of seeds of Aframomum aulacocarpos and citratum, Manihot esculenta leaves with Arachis hypogaea seeds and Telfairia occidentalis leaves with Citrullus colocynthis seeds respectively. These sauces were all associated with Manihot esculenta tuber commonly called “Cassava” (CA).
Materials and Methods
Subjects
Thirty healthy male volunteers were recruited to participate in this study. They were selected on the basis of the following criteria: age 19-29 years, fasting blood glucose 0.7 to 1.1 g/L, non-diabetic, non-smoker, non-obese. Exclusion criteria were: current course of medication, fasting blood glucose higher than 1.26 g/L after an 8-12 hours fasting. Subjects were students from the Faculty of Sciences of the University of Douala (Cameroon). Ethical approval for the study was obtained from the institutional ethical committee of research for human health of the University of Douala. Subjects were given full details of the study protocol and the opportunity to ask questions. All of them gave written informed consent prior to participation to the study. All anthropometrical measurements were made in the fasting state. Height was recorded using a height gauge with subjects standing straight and without shoes. Body weight, fat and hydration percentage and also BMI (Body Mass Index) values were obtained with an impedance scales (Body fat and Hydration Electronic scale), with subjects wearing light clothing and no shoes. Blood pressure measurements were recorded in a tensiometer and waist-to-hip ratio by dividing the waist and hip values obtained with a meter band.
Test foods and preparation
Three traditional meals consumed in Cameroon was tested: The studied sauces commonly called “Bongo’ô Tchobi” (BT), “Kwem with groundnut” (KG) and “Flutted pumkin with pistachio” (FP), were mainly constituted of seeds of Aframomum aulacocarpos and citratum, Manihot esculenta leaves with Arachis hypogaea seeds and Telfairia occidentalis leaves with Citrullus colocynthis seeds, respectively. They were all associated with Manihot esculenta tuber commonly called “Cassava” (CA). The ingredients of the tested foods, the spices of BT and CA were all purchased from the market of Cité-sic in Douala five (Cameroon) meanwhile, the vegetables or leaves (Telfairia and Manihot) were purchased from two farms located in two quarter (PK 21 and JAPOMA) at the periphery of Douala (Cameroon). The meals were prepared in a traditional kitchen respecting all the sanitary conditions, without stabilizer nor genetically modified organism (GMO).
Chemical analysis
Laboratory of the Ground and Earth Sciences of the University of Dschang (Cameroon) analyzed the chemical composition of the study meals. Each component of the meal (carbohydrates accompaniment and sauce) was analyzed for water content [6], fat [7], ash [8], protein [8], and total dietary fiber [9] using standard methods. Available carbohydrates were calculated by difference. Samples were analyzed based on fresh state. Moisture was determined by oven drying of the samples at 560°C for 4 hours. The protein content was estimated (nitrogen × 6.25) from quantitative analysis of nitrogen by using the Kjeldahl method [8]. Total fat was extracted using the Soxhlet method [7]. All this analysis was carried out two times in duplicate.
Study design
The volunteers were invited to participate in the study on four visits spaced from two weeks each. They were divided into four groups (Three groups of eight persons for the three meals, and one negative control group of six persons). The first three groups consumed the three tested meals (one meal was eaten by one group) and the fourth one took only plain water (negative control). On the day prior to the test, subjects were asked to restrict their intake of alcohol and to restrict their participation in intense physical activity. According to the protocol described by Wolever [10], after a 10-14 hours overnight fasting, 0.71 g/ Kg of body weight of glucose (dissolved in 250 mL of pure water) was administered day one of the experiment to all the volunteers for the oral glucose tolerance test (OGTT). The three meals and negative control product were both taken by the different groups of participants on the other three days of the experiment. They were instructed to consume all the food served in a period of 15 min. All test meals were served with 150 mL of pure water. Further, blood samples were taken at 0, 15, 30, 45, 60, 90 and 120 min after consumption. Blood was obtained by finger-prick using a lancet device, a glucometer and blood strips (codeFree).
Calculation of glycemic index
The GI values were computed from the area under the glycemicresponse curve of each food with glucose as reference. The area under the blood glucose response curve was calculated geometrically by applying the trapezoid rule [11] using GraphPad Prism 5 for Windows version 5.01 (GraphPad software, Inc, www. graphpad.com). When a blood glucose value falls below the baseline, only the area above the fasting level is included. The GI of each meal tested was taken as the mean (± sem) for the whole group. GI values were classified as high (70-100), intermediate (55-69) or low (<55) [12].
Statistical analysis
Data were introduced in Microsoft Excel sheet (Microsoft Office, USA) and analyzed with Statview version 5.0 software (SAS Institute, Inc., USA). Qualitative and quantitative data were presented in percentage and mean (± standard deviation). The test one-way ANOVA was used to compare mean values between two groups (n ≥ 2). After, the post hoc PLSD (Pair Least Significant Difference) of Fisher was applied to make the two by two comparisons. The non-parametrical tests of Mann-Whitney and Kruskal-Wallis were respectively used to make comparison between the mean of two groups and more than two groups. The correlation of spearman was used and the threshold value was fixed at p-value <0.050.
Results
Anthropometrical measurements
Thirty healthy male volunteers were recruited. With a fasting blood glucose of 0.88 ± 0.03, their mean age was 24.70 ± 2.15. Their average Body Mass Index (BMI) was 21.98 ± 1.05 (Table 1). No significant difference was found between the characteristics of each groups (p<0.05) and all those characteristics were in line with the standards [13].
| Parameters |
Mean values |
Range [13] |
| Age (years) |
24.70 ± 2.15 |
- |
| Weight (Kg) |
67.09 ± 5.62 |
- |
| Height (m) |
1.73 ± 0.03 |
- |
| BMI (Kg/m2) |
21.98 ± 1.05 |
18.5-25 |
| Fat percentage (%) |
13.08 ± 1.25 |
Oct-15 |
| Systolic blood pressure (mmHg) |
111.29 ± 3.67 |
≤ 130 |
| Diastolic blood pressure (mmHg) |
67.82 ± 1.32 |
≤ 85 |
| Fasting blood glucose (g/L) |
0.88 ± 0.03 |
0.7-1.1 |
Table 1 Descriptive characteristics of study participants at study entry.
Blood glucose response and GI of the test meals
The glycaemic profile (g/L) up to 120 minutes after consumption of the three tested meals and reference food (glucose) is presented on Figure 1. The glycaemic profiles were significantly low at 30 minutes for the three meals (p<0.05) than the reference food (glucose beverage). Bongo. Tchobi paste to Cassava (BT+CA) raised the post-prandial blood glucose at 30 minutes than Kwem with groundnut paste to Cassava (KG+CA) and Flutted pumkin with pistachio paste to Cassava (FP+CA). At 15 minutes, FP raised post-prandial blood glucose than the reference (glucose) compared to BT and KG, all paste to cassava. At 60, 90, 120 minutes, FP+CA was significantly lower than glucose beverage compared to BT and KG associated to cassava. For glucose beverage and for the three tests meals, we observed a return of blood glucose at normal values (0.7-1.1 g/L), 120 minutes after consumption; it suggested that, our participants presented a good tolerance in glucose. The mean GI of each meals is unfolded in Table 2. A significant difference was found between the GI of Bongo Tchobi (BT) and Flutted pumpkin with pistachio (FP) (p<0.05).
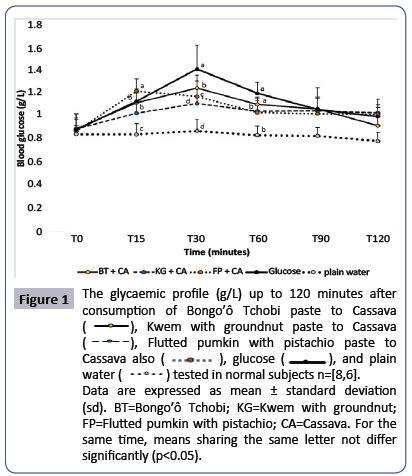
Figure 1: The glycaemic profile (g/L) up to 120 minutes after consumption of Bongo Tchobi paste to Cassava  , Kwem with groundnut paste to Cassava
  , Flutted pumkin with pistachio paste to Cassava also
  , glucose
  , and plain water
  tested in normal subjects n=[8,6]. Data are expressed as mean ± standard deviation (sd). BT=Bongo Tchobi; KG=Kwem with groundnut; FP=Flutted pumkin with pistachio; CA=Cassava. For the same time, means sharing the same letter not differ significantly (p<0.05).
| Parameters |
| Culinary preparation |
AUC-glucose |
AUC-test foods |
GI |
GI Classification |
| BT+CA |
134.40 ± 0.01b |
130.16 ± 1.75ab |
96.85 ± 2.04a |
High |
| KG+CA |
136.70 ± 0.02b |
124.70 ± 2.11a |
91.22 ± 5.20ab |
High |
| FP+CA |
148.50 ± 0.05c |
131.70 ± 3.16b |
88.68 ± 3.47b |
High |
Data are expressed as mean ±standard deviation (sd).
Means in the same column sharing the same letter not differ significantly (p < 0.05).
BT: Bongo Tchobi;KG: Kwem with groundnut;FP: Flutted pumkin with pistachio;CA: Cassava;AUC: Area Under the plasma glucose Curve; GI: Glycaemic index.
Table 2 AUC, glycaemic index and classification of tests meals.
Macronutrients composition of tested meals
For the determination of the macronutrients content of the tested meals, the different sauces and the accompaniment after cooking, were at first dissociated one from the other, and secondly were dried in a dryer before analysis. The results are presented on Figure 2. The carbohydrates content of cassava (CA) was significantly higher than that of the sauces (p<0.05); and the carbohydrates content of Bongo Tchobi (BT) was also high significantly compared to Kwem with groundnut (KG) and Flutted pumkin (FP) with pistachio (p<0.05). The lipids content of KG and FP was high significantly compared to BT and CA. The fibers content was high (p<0.05) for FP than that of BT, KG and CA. The weight of the meals ingested were: 301.07 (for BT); 304.60 (for KG); 306.77 (for FP); and 262.9 (for CA).
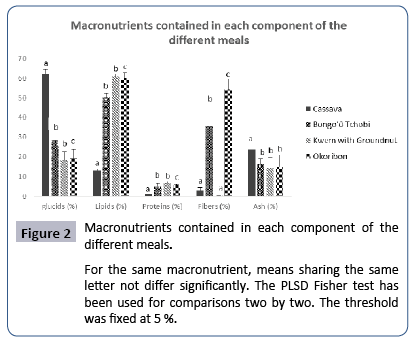
Figure 2: Macronutrients contained in each component of the different meals.
Discussion
According to the official classification of GI [12], data showed that all the tests meals had an effect on post-prandial blood glucose but less than the reference food (glucose). The GI of all the meals was high with a significant difference observed between that of Bongo Tchobi (BT) and Flutted pumkin with pistachio (FP) associated to cassava (CA). The macronutrients analysis showed that the components of the meals (Cassava and the sauces) dissociated one from the other have their selfcomposition. The glucids content was high for cassava than the different sauces (p<0.05). This result correlates with that of FAO who certified that cassava is a high carbohydrate food [14]. The high carbohydrates content of cassava could be due to the high quantity of amylopectin it contains. Amylopectin is more accessible to α-amylase enzymes than amylose because of its ramifications. High temperature and excess water destroy the granular structure of starch. The ratio of amylose and amylopectin of cassava is 30:70 [15]. The correlation test of Spearman was carried out between the macronutrients content of the tests meals (after summing the different macronutrients content of cassava to that of the three sauces) and their GI. A positive correlation was observed between the glucids content and GI (r=0.5; p<0.667) which means that GI increases with the level of available glucids in the meal. Also, a study made in Cameroon on some common African diets eaten as mixed meals demonstrated that the carbohydrate content of meals correlated signiï¬ÂÂÂÂcantly with the level of glycaemic index [16]. So, the high GI of the tested meals was likely due to the high carbohydrates content of cassava than that of all the sauces. A recent study showed after calculating the GI of meals with cassava as carbohydrates accompaniment, that the corresponding GI of the meal was high [17]. These results are contrary to the study of Mbanya made in Cameroon which showed that the GI of cassava paste to a food commonly call “Koki” was low [16]. The GI differed from one meal to another. A significant difference was found between the GI of BT and that of FP (p<0.05) all paste to cassava. Fibers content of FP was significantly higher than that of the other sauces without cassava (p<0.05). A negative correlation was found between fibers in the meals and GI (r=-0.5; p <0.667), which suggests that the more meals contain fibers, the more their GI is low. Fibers are non-digestible glucids which are not directly absorbed, but are fermented by bacteria of the colon to give products such as short-chain fats and gaz. Some of these products are reabsorbed and intervened in modulation of glucose [18]. So, the low GI of FP with CA compared to the other meals could be due to its high content in fibers.
Conclusion
This study provided the macronutrients content and GI values of three traditional Cameroonian’s meals. The different sauces: ‘Bongo Tchobi’, ‘Kwem’ with groundnut and ‘Flutted pumkin’ with pistachio all associated to Cassava, presented high levels of GI. Flutted pumkin associated to Cassava had a GI value lower than that of the other meals because of its high content in fibers. The carbohydrates content of Cassava was significantly higher than that of the individual sauces. These data are intended to serve as nutritional guidelines for the population and will also help nutritionists in diet schedule and formulation of foods proper for specific groups or for people in need to control their diet behavior.
Acknowledgement
Our appreciation goes to both laboratory of Biochemistry of the department of Science of the University of Douala-Cameroon and the laboratory of Earth and ground Sciences of the University of Dschang-Cameroon for the technical platform and for the analysis of our samples. We are also grateful to LABPMAN institute of the University of Dschang-Cameroon and to all the participants of this study.
References
- Jenkins DJ, Wolever TM, Taylor RH, Barker HM, Fielden H, et al. (1981) Glycemic index of foods: a physiological basis for carbohydrate exchange. American Journal of ClinicalNutrition 34: 362-366.
- Liu S, Manson J, Stampfer MJ (2001) Dietary glycemic load assessed by food-frequency questionnaire in relation to plasma high-density-lipoprotein cholesterol and fasting plasma triacyglycerols in post-menopausal women. American Journal of Clinical Nutrition 73:560-566.
- Dickinson S, Brand-Miller J (2005) Glycemic index, postprandial glycaemia and cardiovascular disease. Current Opinion in Lipidology 16:69-75.
- World Health Organization (2011) Record on the world situation of non-communicable diseases: guiding summary, pp: 20.
- World Health Organization (2011) Non communicable disease country profiles.
- AOAC (Association of Official Analytical Chemists) (2000).In: William Horwitz editor. Official methods of analysis of AOAC international (17th edn.), AOAC international, p: 220.
- Bourely J (1982)Observation sur le dosage de l’huile des graines de cotonnier. Coton et Fibres Tropicales 27: 183-196.
- AOAC (Association of Official Analytical Chemists) (1980) Official and tentative methods of analysis. In: William H editor.(13rd edn.), Washingtonp: 978.
- Wolff JP (1986) Manuel d’analyse des corps gras. In: Azoulay éditor. Paris (France), p: 519.
- Wolever TMS (2006) The Glycaemic Index: A Physiological Classification of Dietary Carbohydrate. Biddles Ltd. King’s Lynn editor. UK, p: 227.
- Brouns F, Bjorck I, Frayn KN, Gibbs AL, Lang V, et al. (2005) “Glycaemic Index Methodology.” Nutrition Research Reviews18: 145-171.
- Brand-Miller J, Wolever TMS, Foster-Powell K, Colagiuri S (2003) “The New Glucose Revolution: The Authoritative Guide to the Glycemic Index”. Marlowe and Company, New York.
- Ellis KJ (2000) Human body composition: in vivo methods. Physiological Reviews 80: 649-680.
- Food and Agriculture Organization of the United Nations (2014) Cassava. Retrieved July 15.
- USDA (2002) Retrieved July 15 from Nutrient Database for Standard Reference.
- Mbanya J-CN, Mfopou JK, Sobngwi E, Mbanya DNS, Ngogang JY (2003) Metabolic and hormonal effects of ï¬ÂÂÂÂve common African diets eaten as mixed meals: the Cameroon Study. European Journal of Clinical Nutrition 57: 580-585.
- Divine W (2015) Determination of the Glycemic Index of Local Staples in Ghana and the Effect Of Processing On Them. These: Kwame Nkrumah University of Science and Technology, Kumasi, Ghana,p: 92.
- Nilsson A (2006) Effects of GI and content of indigestible carbohydrates of cereal-based evening meals on glucose tolerance at a subsequent standardized breakfast. European Journal of Clinical Nutrition 60: 1092-1099.