Keywords
Sustained release, Buoyancy, Hardness, Glibenclamide, Swellability.
Introduction
Glibenclamide, a potent hypoglycemic agent, is used to reduce glucose concentration in diabetic human patients to the normal level. Fluctuation of dose delivery of this drug can result in serious hazards, specifically, hypo-glycemia or hyperglycemia and accordingly, accurate dose delivery of the drug seems to be essential [1].
The scope of the present study is to develop and optimize a buoyant tablet formulation capable to deliver glibenclamide in a sustained manner and suitable for once day administration using consecutive application of full factorial, Box- Wilson and composite index experimental designs. Responses selected for optimization of the dosage form using central composite design were tablet swelling, onset of buoyancy, buoyancy duration, and time for 50% drug release, percent of drug released after 1 hour and percent of drug released after 6 hours [2,3].
Although both drug: PVP ratio and hardness were shown to influence the swelling ability of the developed tablets, only tablet hardness has revealed an influential effect on tablet onset of floating. Whilst reduction in drug : PVP ratio resulted in terminal acceleration of drug release, while loading level of calcium hydroxide, stearyl alcohol and tablet swellability all have showed profound enhancing effects on duration of tablet buoyancy and drug release [4].
The optimized buoyant tablet formulation with highest CI revealed hardness of 50 N, immediate onset of floating and floating duration >6 hours. Concerning drug release, the formula showed evidence of 25 and 84% drug release after 1 and 6 hours respectively, with T50% of 3 hours. The in vivo dosage form residence time study in six human subjects demonstrated that the developed tablet formulation retained in the stomach for more than four hours under fasting conditions [5].
Comparative bioavailability study revealed that floating tablets showed increase in residence time of the drug were greater indicating the sustained release tendency of the drug from the floating tablet formulation [6].
Moreover, the study is designed in a way that explored the influence of different formulation variables on physical characters of the developed dosage form and to evaluate the pharmacokinetics of the drug from the developed dosage form compared to Daonil® tablets as a marketed reference drug product [7-10].
Materials
The following materials have been utilized during the experimental part of the research:
Glibenclamide reference standard and raw material (G. Amphray Laboratories, Mumbai, India) were obtained from Wafra Pharma Lab. Sudan and used as received.
HPMC (pharmaceutical grade, 4000cps) is a product of Horst G.F. Von Valtier, Hamburg, Germany.
Polyvinyl pyrrilodone (PVP, DC grade) was a product of FMC, Ireland, and supplied by Wafrapharma lab.
Stearyl Alcohol (Shing Poong Pharmaceutical Co., Seoul, Korea) received as a gift sample from G.M.C. (Sudan).
Isopropanol, Methanol and Acetonitrile were HPLC grade products of Scharlau, Spain.
Calcium Hydroxide, Magnesium stearate, Dihydrogen Phosphate, Sodium Hydroxide, Barium Sulfate, Hydrochloric Acid and Ethylenediamine- tetra-acetic acid are pharmacopoeial grade and were provided by Wafra Pharma lab (Sudan).
Ortho-phosphoric acid (analytical grade, Merk) and Dichloromethane (analytical grade, Loba Chemie, India) were also supplied by Wafra Pharma.
Instructions and Apparatus
The following instruments and equipment were used during the course of the work:
Tablet compression machine (Manesty, 15D4B3/16, England);
Analytical balance (Digital Mettler tolledo, Switzerland);
Monsanto tablet hardness tester; Tablet friability tester; Disintegration tester (Erweka, Germany);
Tablet dissolution tester (DT700 Erweka, Germany) and
U.V. spectrophotometric device (Perkin Elmer Spectrometer, Lambda 11, Germany).
Utilized HPLC was comprised of variable wave length UV detector (Knauer, Germany); Pump (64, Knauer, Germany); Column (250 × 4.6 mm ID, Eurospher-100 C8, 5 μm, Berlin, Germany).
Methods
Experimental Design and Dosage Form Formulations
The screening design initially selected in this study was 32 full factorial experimental design in which two factors namely, drug PVP ratio and tablet hardness each at three levels were investigated within 9 formulation runs for their main and interactive effects on tablet swelling, floating capability and drug release behavior. The design is described fully in the introduction section (under 1.4.1.1.) and presented in Table 1. In these preliminary batches, direct compression was adopted where drug (10 mg/tablet), HPMC (fixed load of 4000cps grade), PVP (different amounts) were passed through 50 mesh, thoroughly mixed for 10 min using mortar and pestle, lubricated with Mg stearate (1% w/w) and compressed into tablets using Manesty tablet presser (15D4B3B/16, equipped with 8 mm flat punch). Various compression loads were adopted to produce tablets of three hardness ranges for each formulation (40-70 N) [11]. Summary of the results concerning the physical characters of tablets within these preliminary batches are tabulated in Table 1 and Figures 1 and 2.
Table 1. Floating capability of tablet formulations in the 32 factorial design
| Formula No. |
Drug: PVP X1 |
Hardness (N) X2 |
Floating ability |
Onset (min) |
| 1 |
+1 (1:2) |
-1 (40) |
+ |
20 |
| 2 |
+1 (1:2) |
0 (60) |
+ |
180 |
| 3 |
+1 (1:2) |
1 (70) |
- |
- |
| 4 |
0 (1:3) |
-1 (40) |
+ |
20 |
| 5 |
0 (1:3) |
0 (60) |
+ |
120 |
| 6 |
0 (1:3) |
1 (70) |
- |
- |
| 7 |
-1 (1:4) |
-1 (40) |
+ |
20 |
| 8 |
-1 (1:4) |
0 (60) |
+ |
300 |
| 9 |
-1 (1:4) |
1 (70) |
- |
- |
(+) float within 20-300 min
(-) sink
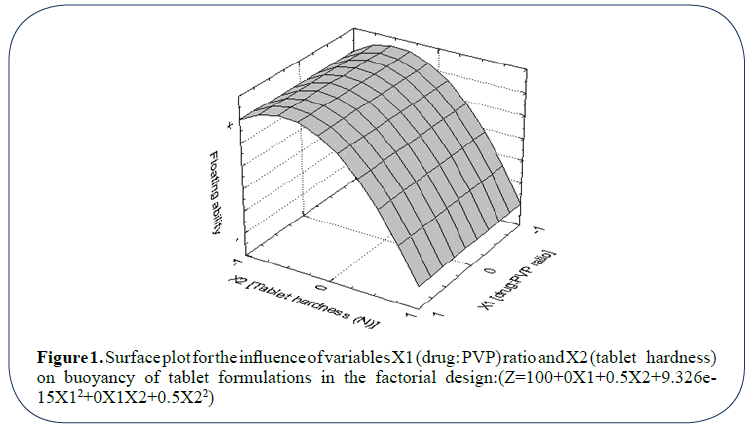
Figure 1: Surface plot for the influence of variables X1 (drug: PVP) ratio and X2 (tablet hardness) on buoyancy of tablet formulations in the factorial design:(Z=100+0X1+0.5X2+9.326e- 15X12+0X1X2+0.5X22)
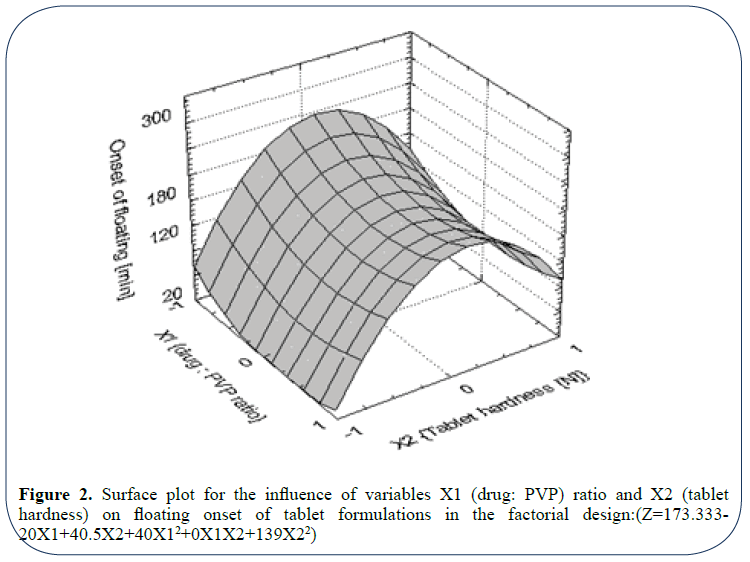
Figure 2: Surface plot for the influence of variables X1 (drug: PVP) ratio and X2 (tablet hardness) on floating onset of tablet formulations in the factorial design:(Z=173.333- 20X1+40.5X2+40X12+0X1X2+139X22)
Buoyancy Studies
Tablets within all formulations in the design were tested for floating capability where six tablets from each formula were investigated. Except for the basket, USP apparatus 2 of dissolution was used where time between introduction of the dosage form and its buoyancy on simulated gastric fluid (0.1 N HCl, pH 1.2, enzyme-free) and phosphate buffer, pH 5.8 at 37°C ± 0.5, rotated at 50 rpm, and the time during which the dosage form remained buoyant were measured [12].
Swelling Studies
To verify for the influence of drug: PVP ratio and hardness on aqueous fluid uptake by tablet and consequently, the dosage form buoyancy and drug release, tablets within all formulations showing floating tendency were subjected to swelling studies where medium uptake into tablet preparations and their weight gaining at pre-selected time point was determined. In this study weighed tablet samples were placed in USP apparatus 2 dissolution baskets at 50 rpm, mounted in simulated gastric fluid (0.1 N HClenzyme- free, and/or phosphate buffer pH 5.8, 500 ml), maintained at 37°C ± 0.5. At pre-determined time point, each basket was withdrawn, and the enclosed wetted tablets were wiped with a piece of paper tissue and weighed [13,14].
The percentage increase in weight due to the absorbed media (Q) was estimated according to the equation:
Q=100(Wf −Wi) /Wi ………….. (1)
where,
Wi and Wf are the initial mass of the tablet and the final hydrated mass of the same tablet after the designated time point.
In vitro Drug Release Studies
In vitro release of the model drug, glibenclamide, from floating tablets within selected formulations tested was determined using USP paddle method. Tablets were investigated in 900 ml 0.1 N HCl, pH 1.2 and phosphate buffer pH 5.8 at 37.0°C ± 0.5 with stirring speed of 50 rpm15. Samples of six tablets for each formula were examined and five ml dissolution samples were withdrawn at intervals filtered (membrane pore filter 0.45 μm) and replaced by an equivalent volume of fresh dissolution medium, kept at the same temperature. Dissolution samples were immediately assayed for glibenclamide [16,17].
Calibration Curve for Reference Standard Glibenclamide
Different dilutions of glibenclamide in phosphate buffer pH 5.8 and 0.1 N HCl were carried out to obtain different solutions of varying concentrations. Absorbance of each solution was measured at 229 nm against blank [18]. Sample absorbance is an indication for the concentration of glibenclamide in that solution. From the data obtained, the calibration curve was generated, and the linear regression equation was found out Figures 3 and 4 using software package Microcal origin (V.6, Microcal Inc. USA)19. Validation of the analytical process was assessed using values of coefficient of variation (CV%) in and between days (Table 2).
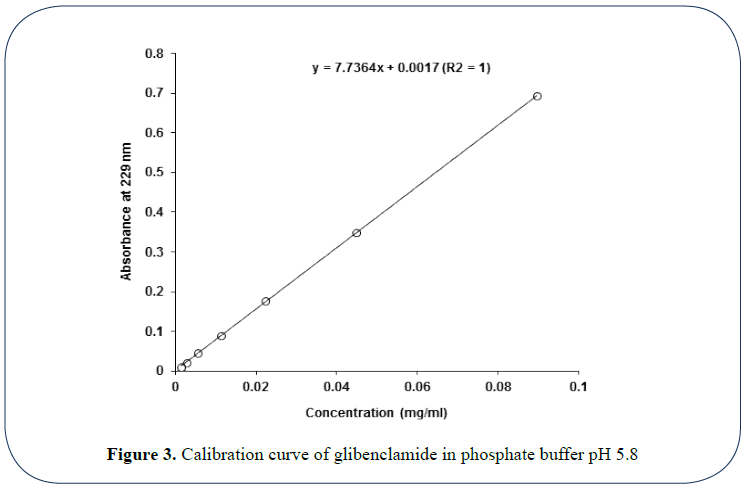
Figure 3: Calibration curve of glibenclamide in phosphate buffer pH 5.8
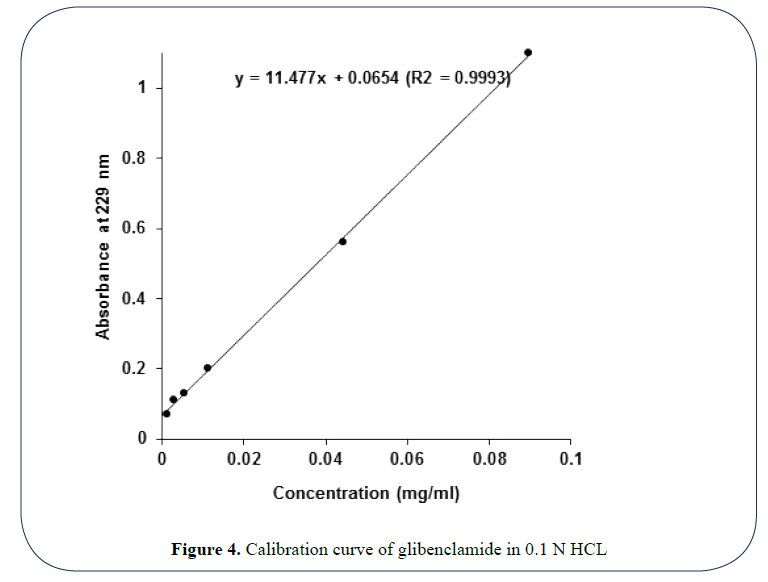
Figure 4: Calibration curve of glibenclamide in 0.1 N HCL
Table 2. Validation of the UV method for glibenclamide assay in dissolution testing
| Concentration level (mg/ml) |
Recovery %a |
CV%b |
| In buffer |
In 0.1 N HCl |
In buffer |
In 0.1 N HCl |
| (Intraday) |
|
|
|
|
| 0.0014 |
101.4% |
100.3% |
5.3% |
4.4% |
| 0.0112 |
101.8% |
101.5% |
4.2% |
3.2% |
| 0.0896 |
99.7% |
100.1% |
5.8% |
3.7% |
| |
|
|
|
|
| (Between days) |
|
|
|
|
| 0.0280 |
101.2% |
100.8% |
6.7% |
5.6% |
| 0.0112 |
100.4% |
101.1% |
5.4% |
4.8% |
| 0.0448 |
99.8% |
99.9% |
7.2% |
5.8% |
a=Accuracy in calculation of the concentration (obtained/actual *100%)
b =Coefficient of variation (standard deviation/mean value *100%)
Determination of Glibenclamide in Dissolution Samples
The filtered samples were measured for glibenclamide concentration using UV spectrophotometry at 229 nm. The obtained absorbance values were converted into concentration values using a general regression equation generated for standard curve run prior to the experiment [20]. Drug released was determined using the regression equation obtained from the calibration curve thus generated (Figure 3). Results of the in vitro glibenclamide release from formulations tested were presented in Figure 5 and Table 3.
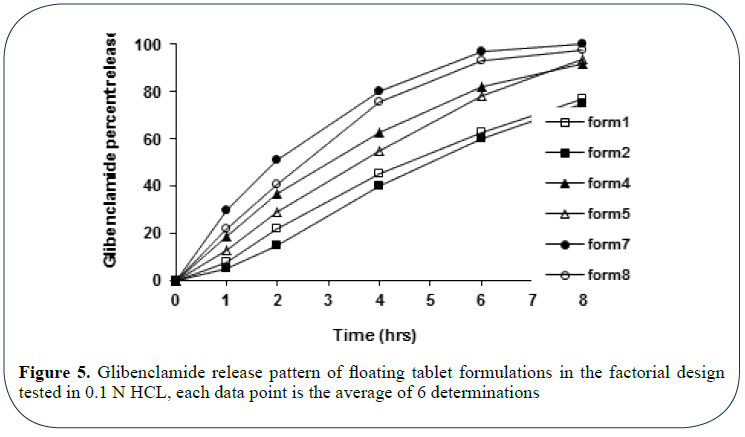
Figure 5: Glibenclamide release pattern of floating tablet formulations in the factorial design tested in 0.1 N HCL, each data point is the average of 6 determinations
Table 3. Drug release characteristics and mechanisms (n) for the different floating formulations in the factorial design
| Formula |
Drug: PVP X1 |
Hardness X2 (N) |
Rel%-1 (%)a |
t50% (hr)b |
Rel%-6 (%) c |
Kd |
ne |
r2f |
| 1 |
1:2 |
40 |
8 |
4.7 |
63 |
0.1301 |
0.8761 |
0.9998 |
| 2 |
1:2 |
60 |
5 |
5.4 |
60 |
0.0783 |
1.0244 |
0.9996 |
| 4 |
1:3 |
40 |
19 |
3 |
82 |
0.1998 |
0.8374 |
0.9985 |
| 5 |
1:3 |
60 |
13 |
3.7 |
78 |
0.1576 |
0.8697 |
0.9989 |
| 7 |
1:4 |
40 |
30 |
2 |
98 |
0.2993 |
0.8212 |
0.9999 |
| 8 |
1:4 |
60 |
22 |
2.5 |
93 |
0.2232 |
0.8598 |
0.9987 |
a=% of drug released in 1 hour
b=Time required for 50% drug release
c=% of drug released after 6 hours
d=Fitting constant
e=Diffusional exponent
f=Correlation coefficient of fitting to the release model
Preparation of Floating Tablets in Box-Wilson Design
Wet granulation was adopted in this section where drug and fixed load of HPMC-4000cps were thoroughly mixed for 10 min using mortar and pestle, wetted with specific constant volume of Ca (OH)2 solution and forced through 12 mesh screen. Granules thus obtained were dried overnight at 50ºC (specification of the oven) [21-24].
To the 12/16 mesh fraction of the granules PVP (different amounts) and stearyl alcohol (if any, different amounts) were added and the blend was mixed for 5 min. The blend was then lubricated with Mg stearate (different percentage content of the formula) and compressed into tablets under various compression loads to produce tablets of different hardness level on Monsanto hardness tester25. Tablets thus obtained were characterized by same drug and HPMC content (10 mg and 70 mg, respectively) and vary with respect to content of PVP, stearyl alcohol, Mg stearate and hardness (Table 1).
Figure 6 is a three-directional surface plot for the influence of tablet hardness and drug: PVP ratio on the magnitude of the diffusional exponent n. From the plot it is apparent that both variables affect the value of n; moreover, medium tablet hardness (transformed 0=50 N) and enhanced ratio of drug: PVP (better is 1: 3) are to be applied in order to obtain tablets having greater magnitude for n (~1, zero order).
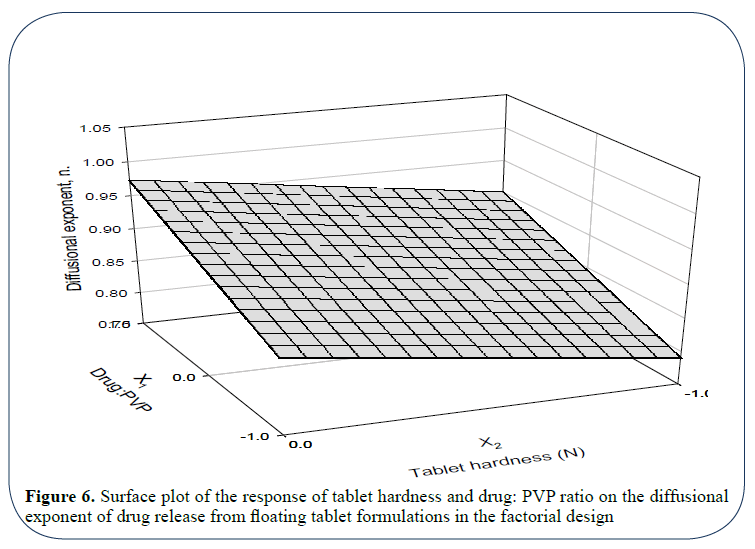
Figure 6: Surface plot of the response of tablet hardness and drug: PVP ratio on the diffusional exponent of drug release from floating tablet formulations in the factorial design
Comparative Bioavailability Study
To examine the comparative bioavailability of the drug from the newly developed formulation, optimized floating formulation of glibenclamide (formulation 19) was tested against the immediate release marketed formula (Daonil® (Hockest) 5-mg tablets, batch No. 13E32, expiry date 7/2006) [26,27].
HPLC Method for Quantification of Glibenclamide in Human Plasma
A high-performance liquid chromatographic (HPLC) method reported by Al-Hazayamah and Abu Lubbad has been adopted, validated and applied with some modifications in this study for the assay of glibenclamide in human plasma [28]. One-ml human plasma samples were placed in ten ml conical glass tubes and spiked with 100 μl of glibenclamide methanolic solutions of different concentrations to produce drug plasma concentration in the range of 0.010-10 μg/ml.
To these samples, 100 μl of Ibuprofen as internal standard (1 mg/ml), three ml of 0.1% ortho-phosphoric acid as a buffer and four ml Dichloromethane as extracting solvent were added. Samples were vortex-mixed for ten seconds, shaken on a rotary mixer for ten min., and centrifuged at 3000 rpm for five min. The organic phase was transferred to a glass centrifuge tube and evaporated to dryness under N2-gas. The residue was reconstituted in 100 ml mobile phase (0.1% ortho-phosphoric acid pH 2.7: isopropanol: acetonitrile, (45: 25: 30) and injected into a reversed phase C-8 column of the HPLC at ambient temperature [29-31].
The eluted drug was monitored by UV detector at 235 nm with sensitivity set at 0.01 AUFS. Mobile phase pump delivery was 1 ml/min. Under such conditions no peak corresponding to glibenclamide was observed in blank drug-free plasma samples treated similarly [32].
Calibration Curve for Reference Standard Glibenclamide in Human Plasma
Glibenclamide 10 mg was dissolved in 100 ml of methanol. This stock solution was diluted ten-fold in methanol to give a working standard solution of one mg/ml. The internal standard Ibuprofen was treated similarly and both solutions were found to be stable at 20ºC for at least one month. Calibration curve was constructed from drug-free human plasma spiked with increasing concentrations of glibenclamide (0.01-4 μg/ml), fixed concentration of the internal standard and processed as described under previous paragraph Peak area ratios of the drug to the internal standard and drug concentrations were used for quantification [33].
Validation of the method was verified using the criteria of RSD and the % recovery values of the drug within and between days, respectively. Results of calibration study were depicted in Figure 7. Parameter values for method validation were summarized in Table 2.
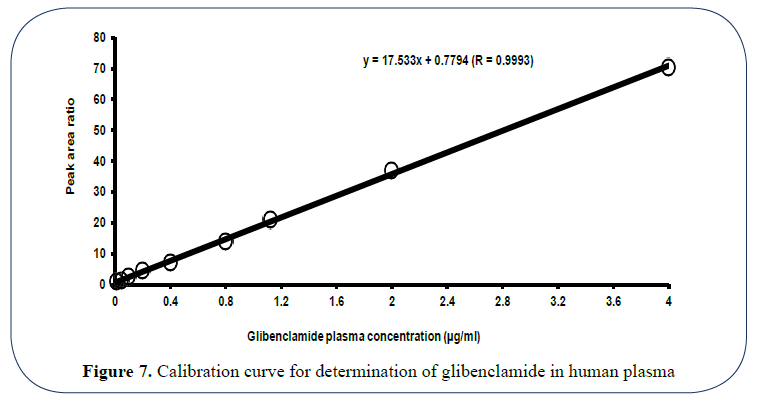
Figure 7: Calibration curve for determination of glibenclamide in human plasma
Subjects for the Comparative Bioavailability Study
Sixteen informed, healthy, non-smoking adult male volunteers (aged 24-44 years and within 12 ± 2% of ideal body weight for height) participated in this study (Metropolitan Life Insurance Company Statistical Bulletin, 1983). Subjects’ selection was based on an acceptable medical history, physical examination, and clinical laboratory test results. Written, informed consent forms have been signed by all participants upon agreeing before they were accepted into the study [34,35].
Dosage Forms Administration and Samples Collection
Volunteers were randomly assigned into two groups (each of eight subjects). Following an overnight fast of at least ten hours, subjects have administered (based on their categorization) a single dose of ten mg of glibenclamide contained in the test (1 floating tablet) or reference product (two tablets) with 240 ml of a 40% glucose solution in water [36].
After dosing, subjects have received 60 ml of a 40% glucose solution in water every 15 minutes for four hours37-39. No additional water or fluids, except for the glucose solution, were allowed from one hour pre-dose to one hour post-dose. Fasting condition was maintained for at least four hours after administration of the test or reference treatment [40].
Food and fluid intake were standardized according to a strict protocol. A sandwich of house-prepared and cooked meat and two cakes were provided at 5, 8, and 12 hours post-administration for all subjects during both phases of the study. The water intake was 250, 250, and 400 ml at 5, 8, and 12 hours post-administration. No Rx or OTC medication was allowed beginning 2 weeks before drug administration and until after the study is completed [41].
Following a 1-week washout period, subjects began the second phase of the study where those that had received the test products in the first run received the reference products in this phase and vice versa [42].
Venous blood samples were collected according to the following time pattern pre-dose (0 hours) and at 0.5, 1, 2, 3, 4, 5, 6, 8, 10, 12, 16, 24, 30 and 36 hours post-dose43. To plasma samples obtained upon immediate centrifugation, 100 μl of internal standard was added and samples were then kept frozen at the temperature below -20ºC for subsequent analysis for glibenclamide. The time elapsed between sample collection and its assay was documented [44,45].
Determination of Glibenclamide in Human Plasma
Frozen plasma samples were drawn out of the fridge, allowed to thaw at room temperature and processed for glibenclamide analysis as described before. Drug plasma time profile plots were then generated for each subject. The average drug plasma-time profiles of the two drug products were plotted in Figure 8.
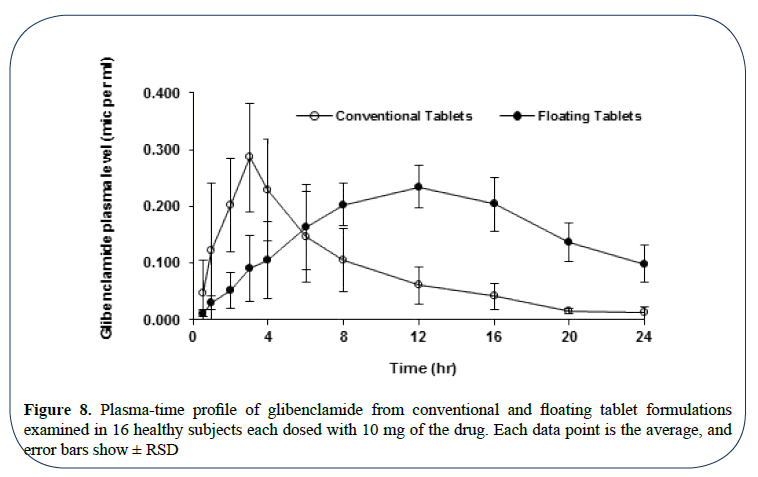
Figure 8: Plasma-time profile of glibenclamide from conventional and floating tablet formulations examined in 16 healthy subjects each dosed with 10 mg of the drug. Each data point is the average, and error bars show ± RSD
Determination of Pharmacokinetic Parameters of Glibenclamide
The individual pharmacokinetic parameters of glibenclamide were derived by noncompartmental analysis using the Statistica 6 (StatSoft, Inc., OK, USA).
The following parameters were derived: the peak plasma concentration Cmax and the time to reach peak plasma concentration tmax (both were observed values); the apparent elimination halflife of glibenclamide t1/2 as determined by loglinear regression analysis of the terminal portion of the plasma concentration-time curve of the drug. The two zero moments AUC0–24 and AUC0–∞ by the linear trapezoidal rule and extrapolation to infinity, respectively [46].
The first moment curve was constructed by the time course data obtained by multiplying the plasma concentration Cp with the corresponding time point. The trapezoidal rule was then used to obtain the area under the first moment curve (AUMC)47-50. The tail area of moment curve (beyond the last data point) was estimated by the equation: tail AUMC=Cpt/k + Cp/k2. Mean residence time (MRT) was calculated by dividing total AUMC by AUC0→∞.
Statistical Data Analysis
The results of the pharmacokinetic parameters (Cmax, Tmax, AUC 0→∞, AUC 0→24) are given as mean ± standard deviation (SD). All data were analyzed by paired t-test and two one-sided t-tests at 90% confidence interval (CI90%) (S-Plus 2000 professional 1, Lucent Technologies, Inc., USA) [51]. A result of p<0.10 was regarded as significant. Summary of the analysis and the final statistical conclusion is presented in Table 4.
Table 4. Average pharmacokinetic parameters of glibenclamide from conventional and floating tablet formulation in16 healthy human subjects
| Parameters |
Conventional tablets (mean ± SD) |
Floating tablets (mean ± SD) |
Floating/ conventional ratio (%) |
CI90% of Floating/conventional ratio (%) |
df |
P** |
| Tmax (hr) |
3.21 ± 1.25 |
9.30 ± 1.22 |
360.71 |
230.04 – 491.39 |
13 |
0.003672 |
| Cmax (µg/ml) |
0.29 ± 0.08 |
0.23 ± 0.04 |
95.30 |
84.68 – 105.91 |
13 |
0.446747 |
| Ln Cmax* |
5.62 ± 0.25 |
5.55 ± 0.16 |
98.79 |
96.79 – 100.79 |
13 |
0.310527 |
| AUC0-24 (µg.hr/ml) |
2.00 ± 0.61 |
3.90 ± 0.68 |
208.34 |
179.53 – 237.14 |
13 |
0.000016 |
| lnAUC0-24* |
7.56 ± 0.31 |
8.26 ± 0.18 |
109.35 |
107.41 – 111.28 |
13 |
0.000001 |
| AUC0-∞ (µg.hr/ml) |
2.08 ± 0.60 |
5.01 ± 1.26 |
254.20 |
217.22 – 291.18 |
13 |
0.000005 |
| ln AUC0-∞* |
7.60 ± 0.30 |
8.49 ± 0.24 |
111.88 |
122.96 – 137.81 |
13 |
0.000001 |
| AUMC (µg.hr2/ml) |
17.01 ± 3.26 |
80.24 ± 8.39 |
471.45 |
290.56 – 524.33 |
13 |
0.000427 |
| MRT (hr) |
8.20 ± 1.77 |
16.02 ± 2.34 |
197.37 |
162.34 – 201.38 |
13 |
0.003328 |
| K (hr-1) |
0.15 ± 0.04 |
0.10 ± 0.03 |
72.22 |
58.28 – 86.17 |
13 |
0.003716 |
| T½ (hr) |
4.90 ± 1.40 |
7.43 ± 2.63 |
160.46 |
131.75 – 189.16 |
13 |
0.002523 |
* Data obtained after log transformation
The unit of Cmax was changed to mcg/L before transformation of AUCs and Cmax
** p ≤ 0.05 considered as significance level for the difference
In vivo Dosage Form Localization Study
In order to correlate the drug level attained in the plasma with dosage form location in the gastrointestinal tract, six out of the 16 subjects participating in the bioavailability study were randomly selected to conduct dosage form localization study one week after phase II of the bioavailability study [52,53].
Formulation of Contrast-Containing Floating Tablets
Contrast-containing floating tablets were produced using the same procedure described under section 3.3.6.1. The formulation being the same as that of formulation 19 which has been subjected to the comparative bioavailability study except for the drug where it was replaced with Ba SO4 as a contrast in an allowable amount (10 mg) [54-56].
Dosage Form Administration
Extended informed consent form was applied in this study. The six subjects participating in this study were randomly assigned into two groups each of three subjects. In one group, dosage forms were administered under fasting condition with 150 ml water57. Fasting conditions were maintained four hours post-administration. In the other group, dosage forms were administered under non-fasting condition with the same amount of water. In both groups, X-Ray pictures were taken two and five hours post-administration to evaluate the location of dosage form in the gastrointestinal tract [58].
Results and Discussion
The high volume of the obtained result compared to the limited total numbers of formulations conceived in this study clearly reflect the potential role of the experimental design in development, evaluation and optimization of pharmaceutical formulations. In fact, application of such design has result in saving considerable amount of raw material and shortening the time for this study to complete.
The Influence of Drug: PVP Ratio and Tablet Hardness on Dosage Form Buoyancy
At this level, the floating ability of the developed dosage form is a function of the dosage form hardness (X2) where tablet floating ability is significantly enhanced when tablets were compressed to low hardness level (40 N). Drug: PVP ratio showed no (or a little effect) on dosage form buoyancy. The same results could be obtained from analysis of regression coefficient accompanying each variable, which appear in the polynomial regression equation attached in Figure 1. Summary of the results concerning the physical characters of tablets within these preliminary batches are tabulated in Table 1.
Coefficient associated with the variable X2 (hardness) is greater than that of X1 (drug: PVP ratio). Moreover, no interaction between the two variables was shown to affect the tablet buoyancy (coefficient associated with the term X1X2 in the equation is 0). Furthermore, the positive sign accompanying the terms X2 and X22 indicates the positive contribution of the variable X2 (hardness) in tablets buoyancy.
Figure 2 is 3D surface plot concerned with onset of tablet floating among different floating tablet formulations. It showed that the variable X2 (tablet hardness) is a determining factor for the quickness of tablet floating where short time for floating onset is achievable in case of tablet formulations with low hardness level which supports the concept derived before.
Evident from the plot, drug: PVP ratio (X2) has no (or a little) in the onset of tablet floating; however, the use of medium-high drug: PVP ratio seems to be better than low ratio. The same conclusion could easily be derived from the regression coefficients of the two variables appearing in the accompanying regression equation.
Table 1 indicates that the floating tablet formulations differ widely with regard to onset of floating; however, once the tablet floated, it remained buoyant till the end of the experiment run (six hours).
It is well documented that compression of tablets to high hardness levels significantly reduces tablet porosity which, in turn, affects the initial water penetration and consequently, delays the onset of tablet floating. However, with time this phenomenon might be offset by the high affinity of the polymer HPMC to water and accordingly tablet achieves a delayed floating as the result implies. Based on these findings on floating ability, the different formulations could be ranked as follow: 1, 4, 7 (were the best), 5, 2, 8, 3, 6, and finally 9.
Consequently, one might conclude that: a) for rapid onset of floating, low level of hardness (40-50 N) should be adopted and b) PVP content has no (or a little effect) on tablet buoyancy; however, drug: PVP ratio better to be 1:3-1:2 w/w. Accordingly, formulations 1, 4, and 7 were considered as promising; however, they need to be further differentiated with respect to the floating duration.
In vitro Drug Release Characteristics
Calibration curve of glibenclamide in phosphate buffer pH 5.8: Figure 3 shows the relation between glibenclamide different concentrations (mg/ml in phosphate buffer) and their respective UV absorbance at 229 nm. The plot reflects an excellent linear correlation between drug concentration and absorbance with high determination coefficient (R2=1) as shown below. And the following equation could be applied efficiently to monitor drug concentration in the solution based on the measured solution absorbance where drug concentration (mg/ ml)=(Abs – 0.0017) / 7.7364.
Calibration curve of glibenclamide in 0.1 N HCl: The obtained graph in Figure 4 shows an excellent linear correlation between drug concentration and absorbance with a highlyaccepted determination coefficient (R2=0.9993) in the concentration range 0.0014-0.0896 mg/ ml. And the following equation could be applied efficiently to monitor drug concentration in the solution based on the measured solution absorbance where drug concentration (mg/ ml)=(Abs-0.0654)/11.477.
In both of cases, precision, accuracy and reproducibility of the UV method in glibenclamide determination were validated using the criteria of recovery % and coefficient of variation (CV%) inter- and intra-day at three different concentration levels as shown below Table 2. Minimum concentration of glibenclamide that can be determined with high precision and accuracy using this method is 0.0014 mg/ml, which is considered as an acceptable sensitivity limit.
Based on the two criteria shown in Table 2, together with other considerations concerning the nature of the developed dosage form as gastroretentive tablets, 0.1 N HCl was selected as dissolution medium to investigate for the in vitro glibenclamide release from the different floating tablet formulations.
Effect of Drug: PVP Ratio on the In vitro Drug Release
Figure 5 shows the release pattern of glibenclamide from different floating tablet formulations of the preliminary batches tested in 0.1 N HCl. Release data of floating tablet formulations characterized by the same hardness level were compared (at two hardness levels 40 and 60 N) in order to investigate the influence of Drug: PVP ratio in the drug release. Accordingly, drug release profiles of formulations 1, 4, and 7 (tablet hardness 40 N) and formulations 2, 5, and 8 (Tablet hardness of 60 N) were separately compared within each group. This might better be explained in terms of the enhanced drug solubility caused by PVP.
Release Kinetics
In swellable matrix tablets, drug release kinetics are associated with the dynamics of gel layer thickness. The relative contributions of drug diffusion, polymer relaxation and matrix erosion to drug release in HPMC cylindrical matrices produce n values that range from 0.5 to 1.0.
Based on data in Table 3, both drug diffusion and polymer chain relaxation seem to control the drug release from these floating tablets. Numerous reports, concerned with the contribution of more than one mechanism in the release of sparingly soluble drugs from matrix tablets, are documented in the literature.
Influence of Hardness on Drug Release from Floating Tablet Formulations
Drug release of floating tablet formulations characterized by the same drug: PVP ratio was compared at different hardness levels in order to examine the role of the applied compression force (during manufacture of these tablet formulation) on the drug release. Formulations compared were 1 and 2; 4 and 5; 7 and 8 for the drug: PVP ratios of 1:2, 1:3, and 1:4, respectively. Parameters considered in the comparison were those mentioned before. Table 3 shows drug release characteristics and mechanisms (n) for the different floating formulations in the factorial design.
Based on data derived in Table 4, and at the three drugs: PVP ratios, increasing the tablet hardness seem to result in significant delay in the initial drug release as indicated by values of Rel%-1 accompanying the respective formulations (p<0.05). However, no significant effect of hardness variation was revealed on the terminal drug release profiles of the different formulations (p>0.05). This could easily be traced from T50% and Rel%-6 values of different formulations. In fact, this might be attributed to the lowered tablet porosity caused by the application of relative compression force during manufacture which, in turn, results in delay in the drug release owing to delay in the initial water penetration into the tablets. With time this effect might be offset by the high affinity of HPMC to the aqueous fluid and, consequently, no significant difference in the terminal drug release was traced from different formulations at the three different levels of drug: PVP ratios.
Statistical Optimization of Formulations Using Composite Index Method
Derringer and Suich illustrated how several response variables can be transformed into a desirability function. Composite index has been applied for statistical optimization of drug formulations in different cited reports. And as the relative contribution of each individual constraint to the true composite score was unknown, a decision was made to assign an arbitrary value of one-third to each of the three dependent variables.
Since higher or lower values of floating, swelling and drug release responses investigated in this study may not be desirable, an ideal is most suitable. The empirical composite index was devised to yield a score of 100 for an optimum result for each of the three variables in each step and each test result was transformed to a value between 0 and 33.33. The batch having a highest composite index would be considered as a batch fulfilling all the six constraints favorable for a 24-hr sustained release of glibenclamide floating tablets.
It is worth mentioning that composite index statistical technique has been selected in this study in order to reduce the possible increase in the number of formulations run and that was for economical reasons. Moreover, having known the mathematical model that could be applied efficiently to describe the effects of different variables on performance of the bestchosen batch, one easily can optimize further such formulations to meet other constraints. Comparing the results derived from the two separate steps, a decision could easily be made with regard to the best buoyant batch fulfilling all of the six constraints.
From the results of Step I shown in Table 5, formulation 4 gained the highest score among other formulations and seems to be the best with regard to the specified constraints; whereas, both formulations 4 and 8 were ranked similarly (CI=40), when the other three constraints evolved as indicated by results of Step II (Table 6).
Table 5. Summary of composite index estimation for constraints in Step I of formulations in the factorial design
| Formula |
Rel%-1a |
Fonsetb |
nc |
Transformed |
CId |
| Rel%-1 |
Fonset |
N |
| 1 |
8 |
20 |
0.8761 |
0 |
22.22 |
12.68 |
34.90 |
| 2 |
5 |
180 |
1.0244 |
0 |
0 |
29.26 |
29.26 |
| 4 |
19 |
20 |
0.6374 |
21.67 |
22.22 |
0 |
43.89 |
| 5 |
13 |
120 |
0.8697 |
1.67 |
0 |
11.62 |
13.29 |
| 7 |
30 |
20 |
0.8212 |
8.3 |
22.22 |
3.53 |
34.05 |
| 8 |
22 |
300 |
0.8598 |
31.67 |
0 |
9.97 |
41.64 |
a=% of drug released in 1 hour
b=Time required for onset of tablet floating
c=Diffusional exponent
d=composite index
Table 6. Summary of composite index estimation for constraints in step II of formulations in the factorial design
| Formula |
t50%a |
S%b |
Rel%-6c |
Transformed |
CId |
| t50% |
S% |
Rel%-6 |
| 1 |
4.7 |
660 |
63% |
0 |
0 |
0 |
0 |
| 2 |
5.4 |
520 |
60% |
0 |
0 |
0 |
0 |
| 4 |
3 |
500 |
82% |
33.33 |
0 |
6.67 |
40 |
| 5 |
3.7 |
450 |
78% |
10 |
16.67 |
0 |
26.67 |
| 7 |
2 |
340 |
98% |
0 |
13.33 |
6.67 |
20 |
| 8 |
2.5 |
300 |
93% |
16.67 |
0 |
23.33 |
40 |
a=time for 50% drug release
b=% swelling at 6hrs time interval
c=% of drug released after 6 hours
d=composite index
Since the onset of floating is a critical criterion for dosage forms that are claimed to act as a buoyant system, formulation 4 (Fonset=20 min) is considered as being better than formulation 8 (Fonset=300 min). It is worth mentioning that although formulation 7 exhibited an acceptable floating limitation and optimum swelling character, yet it fails to gain high score with regard to drug release, which might be attributed to the accelerated drug release from this formulation. This clearly demonstrates the power of the composite index in the evaluation of the proposed factorial design.
Nevertheless, based on the attained score of formulation 4 (40-43.89%), it might be necessary and advantageous to optimize further this formula specifically with regard to hardness, onset of floating and n magnitude. In other words, the hardness is to be increased to a relative high hardness level (50 N); onset of floating is to be reduced to 0-10 minutes maximally; and magnitude of n is to be increased so as to achieve the desirable uniform zero order release kinetics (>0.89). These are the three new objectives.
Floating Tablet Formulations in the Factorial Design
Obviously, interaction between formulation variables could possibly results in contradiction between the first and the second objectives since any change in tablet hardness as a result of increase in magnitude of applied force of compression will definitely affect the porosity of the produced tablets which, in turn, would significantly reduce the capability of the tablet with regard to the immediate and prompt floating (floating onset will be increased). In fact, this might be overcome by incorporating a minor fraction of suitable floating enhancer where tablets with both satisfactory hardness and floating characters could be obtained.
In vivo Investigations Calibration Curve of Glibenclamide in Human Plasma
The drug concentrations in spiked plasma samples were found to be linearly related with the peak area ratio of the drug to the internal standard within the investigated plasma drug concentration range (0.01-4 μg/ml) (Figure 7). Regression coefficient of the relation (r=0.9993) was an evidence for the linearity and precision. Minimum concentration of glibenclamide that could be determined by this method was 0.015 μg/ml with signal/noise (S/N) ratio of three. However, quantitative detection limit was considered as 0.03 μg/ml, which is an acceptable sensitivity. Table 7 shows the values of validation parameters for the HPLC method adopted for glibenclamide assay in human plasma at three different concentration levels. Values of RSD and % recovery in both intra and between days were within the limit to consider the method as efficient, sensitive and reproducible.
Table 7. Validation of the HPLC method for glibenclamide assay in human plasma
| Concentration level |
% Recoverya |
RSDb |
| Intraday |
|
|
| 0.05 µg/ml |
98.8% |
3.4 |
| 1 µg/ml |
95.7% |
7.3 |
| 10 µg/ml |
101.2% |
5.2 |
| Between days |
|
|
| 0.05 µg/ml |
100.4% |
8.7 |
| 1 µg/ml |
97.5% |
7.2 |
| 10 µg/ml |
98.3% |
9.1 |
a=Accuracy in calculation of the concentration (obtained/actual *100%)
b=Coefficient of variation (standard deviation/mean value *100%)
Pharmacokinetic Parameters Assessment
The average pharmacokinetic parameters and statistical momentum of glibenclamide from both conventional and floating tablets tested in 16 subjects were summarized in Table 4 and Figure 8 shows plasma-time profile of glibenclamide from conventional and floating tablet formulations examined in 16 healthy subjects each dosed with 10 mg of the drug, each data point is the average, and error bars show ±RSD. Pharmacokinetic parameters of glibenclamide associated with conventional tablets are in agreement with the relevant published data.
Although time to reach peak drug plasma concentration (Tmax) for the floating tablets was delayed by three fold of that for the conventional ones, such delay might not significantly affect the efficiency of the developed tablets in glibenclamide delivery and even beyond Tmax interval, the attained glibenclamide plasma concentrations from the floating tablets were greater than the reported MEC value. This delay might be attributed to the slow drug presentation to absorption characterizing the floating tablet formulation. Nevertheless, the onset of action might not be affected by this delay specifically with this drug.
Figure 9 shows the HPLC chromatogram for human plasma sample spiked with 100 μl of 10 μg/ml solution of glibenclamide (Rt=6.78) and the internal standard Ibuprofen (1 mg/ml, Rt=5.70).
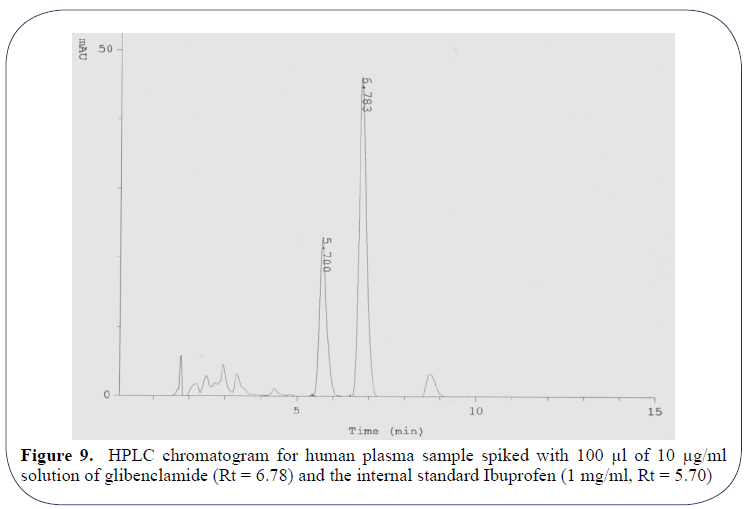
Figure 9: HPLC chromatogram for human plasma sample spiked with 100 μl of 10 μg/ml solution of glibenclamide (Rt = 6.78) and the internal standard Ibuprofen (1 mg/ml, Rt = 5.70)
The in vivo dosage form residence time study in six human subjects demonstrated that the presence of food has a profound retarding influence on gastric emptying of the developed floating tablets. Expectantly, the presence of food delays the gastric emptying rate and hence the dosage form trapped for prolonged period (6 hrs) compared to fasting conditions (3-5 hrs) as the results imply by Figures 10a and 10b. Whatever the case may be, developed tablet formulation showed a capability to be retained in the stomach for at least more than 4-5 hours.
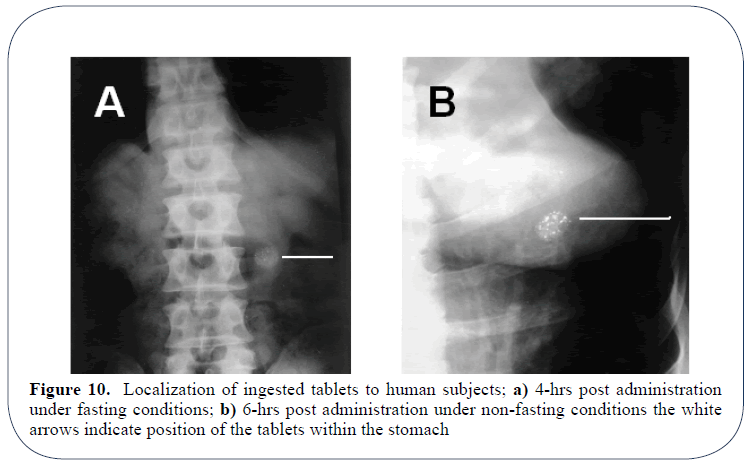
Figure 10: Localization of ingested tablets to human subjects; a) 4-hrs post administration under fasting conditions; b) 6-hrs post administration under non-fasting conditions the white arrows indicate position of the tablets within the stomach
When the results of comparative bioavailability and localization studies were simultaneously considered, it was evident that both delayed gastric emptying and the sustained drug release of the developed tablet formulation have contributed to the in vivo drug delivery with less fluctuations over 24 hrs. In other words, neither tablet floating alone nor drug sustainability only could enhance bioavailability and in vivo durability of glibenclamide and to achieve these targets both factors are to be considered.
Stability Study
The three month based stability study indicated that the drug and the dosage form retained their initial physical characters in both accelerated and normal conditions for the test duration as far as blister pack is considered.
References
- Al-Hazayamah NI, Lubbad A. Simultaneous high performance liquid chromatography determination of three sulfonylureas in plasma. JCPSP. 2001;11(5):304-7.
- Arora, S, Ali J, Ahuja A, et al. Floating drug delivery systems: A review. AAPS Pharm Sci Tech. 2005;6(3).
- Baveja SK, Ranga RKVl, Padmalatha DK. Zero-order release hydrophilic matrix tablets of ß-adrenergic blockers. Int J Pharm. 1987;39:39-45.
- Betageri GV, Makaria KR. Characterization of glyburide-polyethylene glycol solid dispersions. Drug Dev Ind Pharm. 1996;22:731-4.
- Betageri GV, Makaria KR. Enhancement of dissolution of glyburide by solid dispersion and lyophilization techniques. Int J Pharm. 1995;126:155-60.
- Bitzen PO, Melander A, Schersten B. Long-term effects of glipizide on insulin secretion and blood glucose control in patients with non-insulin-dependent diabetes mellitus. Euro J Clin Pharmacol. 1992;42:77-82.
- Box GEP, Meyer RD. Ispersion effects from fractional designs. Technometrics. 1986;28:19-27.
- Box GEP, Wilson KB. On the experimental attainment of optimum conditions. J Roy Statist Soc.1951;13:1.
- Chalk JB, Patterson M, Smith MT, et al. Correlations between in vitro dissolution, in vivo bioavailability and hypoglycemic effect of oral glibenclamide. Eur J Clin Pharmacol. 1986;31:177-82.
- Choi BY, Park HJ, Hwang SJ, et al. Preparation of alginate beads for floating drug delivery system: effects of CO2 gas-forming agents. Int J Pharm. 2002;239:81-91.
- Coppack SW, Lant AF, McIntosh CS, et al. Pharmacokinetic and pharmacodynamic studies of glibenclamide in non-insulin-dependent diabetes mellitus. Br J Clin Pharmac. 1990;29:673-84.
- Derringer G, Suich R. Simultaneous optimization of several response variables. Journal of Quality Technology. 1980;12(4):214-19.
- Dileep B, Anand RB, Donald D.Once-a-day controlled release sulfonylurea formulation. United States Patent. 2005.
- Efentakis M, Koutlis A, Vlachou M. Development and evaluation of oral multiple-unit and single unit hydrophilic controlled release systems. AAPS Pharm Sci Tech. 2000;1(4):34.
- El-Sayed YM, Suleiman MS, Hasan MM, et al. Comparison of the pharmacokinetics and pharmacodynamics of two commercial products containing glibenclamide. Int J Clin Pharmacol Ther Toxicol. 1989:27:551-57.
- Herfindal ET. Acute actions of sulfonylurea drugs during long-term treatment of non-insulin-dependent diabetes mellitus. Diabetes Care. 1990;13:26-31.
- Fisher RA. The Design of Experiments, Oliver and Boyd, London. 1926.
- Galal S, El-Massik M, Abdallah O, et al. Formulation of fast release glibenclamide liquid and semi-solid matrix filled capsules. Acta Pharm. 2003;53:57-64.
- Garg S, Sharma S. Gastroretentive drug delivery systems. Business briefing: Pharmatech Web Site, 5th edition. May 2003.
- GeneidiAS, Adel MS, Shehata E. Preparation and in vitro dissolution characteristics of various fast release solid dispersions of glibenclamide. Can J Pharm Sci. 1980;5:78-80.
- Geneidi AS, Adel MS, Shehata E. Enhanced dissolution of glibenclamide from glibenclamide-poloxamer and glibenclamide-PVP co-precipitate. Can J Pharm Sci. 1980;15:81-4.
- Gohel MC, Patel MM, Amin AF. Development of modified release Diltiazem HCl tablets using composite index to identify optimal formulation. Drug Dev Ind Pharm. 2003;29(5):565-74.
- Hogan JE. Hydroxypropyl methylcellulose sustained release technology. Drug Dev Ind Pharm. 1989;15:975-99.
- Jantzen GM, Robinson JR. Sustained and controlled-release drug delivery system in modern pharmaceutics. 1996;72:575-610.
- Katayama H, Nishimura T, Ochi S, et al. Sustained release liquid preparation using sodium alginate for eradication of Helicobacter pylori. Biol Pharm Bull. 1999;22:55-60.
- Klausner EA, Lavy E, Friedman M, et al. Expandable gastroretentive dosage forms. J Control Rel. 2003;90:143-62.
- Klausner EA, Lavy E, Stepensky D, et al. Furosemide pharmacokinetics and pharmacodynamics following gastroretentive dosage form administration to healthy volunteers. J Clin Pharmacol. 2003;43:711-20.
- Lebovitz HE, Melander A. Sulfonylureas: Basic aspects and clinical uses. International textbook of diabetes mellitus. 1992.
- Li S, Lin S, Daggy BP, et al. Effect of formulation variables on the floating properties of gastric floating drug delivery system. Drug Dev Ind Pharm. 2002;28(7);783-93.
- Malinowski HJ. Biopharmaceutics aspects of the regulatory review of oral controlled release drug products. Drug Dev Ind Pharm. 1983;9(7):1255-79.
- Marchetti P, Navalesi R. Pharmacokinetic-pharmacodynamic relationships of oral hypoglycaemic agents. Clin Pharmacokinetics.1989;16:100-28.
- Mojaverian P, Vlasses PH, Kellner PE, et al. Effects of gender, posture, and age on gastric residence time of an indigestible solid: pharmaceutical considerations. Pharm Res. 1988;10:639-44.
- Moursy NM, Afifi NN, Ghorab DM, et al. Formulation and evaluation of sustained release floating capsules of Nicardipine hydrochloride. Pharmazie. 2003;58:38-43.
- Mutalik S, Udupa N. Formulation development, in vitro and in vivo evaluation of membrane controlled transdermal systems of glibenclamide. J Pharm Pharmaceut Sci. 2005;8(1):26-38.
- Myers RH. Response surface methodology-current status and future directions. J Qual Technol. 1990;31(1):30-44.
- Nolte MS, Karam JH. Pancreatic hormones and antidiabetic drugs, in Katzung BG (eds), Basic and clinical pharmacology. 8th ed., Lange Medical Books/McGraw-Hill Publishing Division. 2001;711-34.
- Nur AO, Hassan AH, Mustafa AF. Hydroxypropyl methylcellulose-Stearyl alcohol based floating tablet: Design and in vitro evaluation. OJPS. 2005;1(1):1-16.
- Nur AO, Zhang JS. Captopril floating and/or bioadhesive tablets: Design and release kinetics. Drug Dev Ind Pharm. 2000;26:965-69.
- Ozdemir N, Ordu S, Ozkan Y. Studies of floating dosage forms of furosemide: in vitro and in-vivo evaluation of bilayer tablet formulation. Drug Dev Ind Pharm. 2000;26(8):857-66.
- Ponchel G, Touchard F, Wouessidjewe D, et al. Bioadhesive analysis of controlled-release systems. III. Bioadhesive and release behavior of metronidazole-containing poly (acrylic acid)-hydroxy-propyl methylcellulose systems. Int J Pharm. 1987;38:65-70.
- Ponchel G, Irache JM. Specific and non-specific bioadhesive particulate systems for oral delivery to the gastrointestinal tract. Adv Drug Del Rev. 1998;34(3):191-219.
- Rubinstein MH. Tablets in pharmaceutics: The science of dosage form design. Aulton M.E. (ed.), Churchill Livingstone Inc., NY, USA.1988;304-21.
- Rudnic EM, Kottle MK. Tablet Dosage Forms. Modern Pharmaceutics. 1996;72:333-94.
- Rudnic EM, Schwartz JB. Tablets. Remington’s the science and practice of pharmacy. 2000;585-893.
- Sheth PR, Tossounian J. The hydrodynamically balanced system (HBSTM): A novel drug delivery system for oral use. Drug Dev Ind Pharm. 1984;10(2):313-39.
- Singh BM, Kim KH. Floating drug delivery systems: An approach to controlled drug delivery via gastric retention. J Control Rel. 2000;63:235-59.
- Streubel A, Siepmann J, Bodmeier R. Floating matrix tablets based on low density foam powder: effect of formulation and processing parameters on drug release. Eur J Pharm Sci. 2003;18:37-45.
- Sullivan D, Cashman WF. Blood glucose variation and clinical response with glibenclamide in diabetes mellitus. Br Med J. 1970;2:572-74.
- Talwar N, Sen H, Staniforth JN. Orally administered controlled drug delivery system providing temporal and spatial control. 2001.
- Tashtoush BM, Alaashi ZS, Najib NM. In vitro and in vivo evaluation of glibenclamide in solid dispersion systems. Drug Dev Ind Pharm. 2004;30(6):601-07.
- Taylor M, Ginsburg J, Hickey A, et al. Composite method to quantify powder flow as a screening method in early tablet or capsule formulation development. Pharm Sci Tech. 2000;1(3):18.
- Timmermans J, Moes AJ. Factors controlling the buoyancy and gastric retention capabilities of floating matrix capsules: New data for reconsidering the controversy. J Pharm Sci. 1994;83:18-24.
- Ukonne SD, Mendes RW, Jambhekar SS. Dried molasses as a direct compression matrix for oral controlled release drug delivery II: Release mechanism and characteristics of theophylline from a HPMC matrix. Drug Dev Ind Pharm. 1989;15(5):719-41.
- USP 26-NF 21, Glyburide tablets- in vivo bioequivalence and in vitro dissolution testing. The United States Pharmacopoeial Convention, Inc., Rockville, Maryland. 2003.
- USP XXIII/ NF XVIII, United States Pharmacopoeial Convention Inc, USA. 1995.
- Varma MM, Jayaswal SB, Singh J. In vitro and in vivo evaluation of fast release solid dispersions of glibenclamide. Indian Drugs. 1992;29;608-11.
- Whitehead L, Collett JH, Fell JT. Amoxycillin release from a floating dosage form based on alginates. Int J Pharm. 2000;210:45-49.
- Yamaoaka K, Nakagawa T, Uno T. Statistical moments in pharmacokinetics. J Pharmacoki Biopharm. 1978;6(6):457-557.